INSIGHTS, RESEARCH | March 29, 2022

Batteries Not Included: Reverse Engineering Obscure Architectures

Introduction

I recently encountered a device whose software I wanted to reverse engineer. After initial investigation, the device was determined to be using a processor based on Analog Devices’ Blackfin architecture. I had never heard of or worked with this architecture, nor with the executable format used by the system, and little to no support for it was present in existing reverse engineering tooling. This article will cover the two-week journey I took going from zero knowledge to full decompilation and advanced analysis, using Binary Ninja. The code discussed in this article can be found on my GitHub.

Special thanks to everyone on the Binary Ninja Slack. The Binary Ninja community is excellent and the generous help I received there was invaluable.

Overview

While the x86 architecture (and increasingly, ARM) may dominate the home PC and server market, there is in fact a huge variety of instruction set architectures (ISAs) available on the market today. Some other common general-purpose architectures include MIPS (often found in routers) and the Xtensa architecture, used by many WiFi-capable IoT devices. Furthermore many specialized architectures exist, such as PIC (commonly found in ICS equipment) and various Digital Signal Processing (DSP) focused architectures, including the Blackfin architecture from Analog Devices, which is the focus of this article.

This article, will explore various techniques and methodologies for understanding new, often more obscure architectures and the surrounding infrastructure which may be poorly documented and for which little to no tooling exists. This will include:

  1. Identifying an unknown architecture for a given device
  2. Taking the first steps from zero knowledge/tooling to some knowledge/tooling,
  3. Refining that understanding and translating it to sophisticated tooling
  4. An exploration of higher-level unknown constructs, including ABI and executable file formats (to be covered in Part 2)

The architecture in question will be Analog Devices’ Blackfin, but the methodologies outlined here should apply to any unknown or exotic architecture you run across.

Identifying Architecture

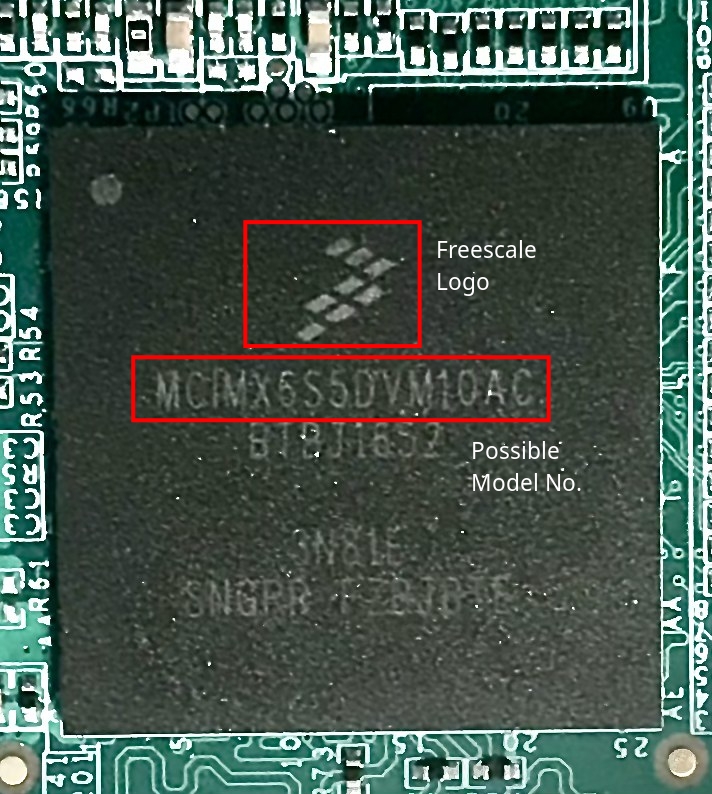
When attempting to understand an unknown device, say a router you bought from eBay, or a guitar pedal, or any number of other gadgets, a very useful first step is visual inspection. There is quite a lot to PCB analysis and component identification, but that is outside of the scope of this article. What we are interested in here is the main processor, which should be fairly easy to spot — It will likely be the largest component, be roughly square shaped, and have many of the traces on the PCB running to/from it. Some examples:

More specifically, we’re interested in the markings on the chip. Generally, these will include a brand insignia and model/part number, which can be used together to identify the chip.

Much like Rumpelstiltskin, knowing the name of a processor grants you great power over it. Unlike Rumpelstiltskin, rather than magic, the source behind the power of the name of a processor is the ability to locate it’s associated datasheets and reference manuals. Actually deriving a full processor name from chip markings can sometimes take some search-engine-fu, and further query gymnastics are often required to find the specific documentation you want, but generally it will be available. Reverse engineering completely undocumented custom processors is possible, but won’t be covered in this article.

Pictured below are the chip markings for our target device, with the contrast cranked up for visibility.

We see the following in this image:

  • Analog Devices logo, as well as a full company name
  • A likely part number, “ADSP-BF547M”
  • Several more lines of unknown meaning
  • A logo containing the word “Blackfin”

From this, we can surmise that this chip is produced by Analog Devices, has part number ADSP-BF547M, and is associated with something called Blackfin. With this part number, it is fairly easy to acquire a reference manual for this family of processors: the Analog Devices ADSP-BF54x. With access to the reference manual, we now have everything we need to understand this architecture, albeit in raw form. We can see from the manual that the Blackfin marking on the chip is in fact referring to a processor family, which all share an ISA, which itself is known also known as Blackfin. The the Blackfin Processor Programming Reference includes the instruction set, with a description of each operation the processor is capable of, and the associated machine code.

So that’s it, just dump the firmware of the device and hand-translate the machine code into assembly by referencing instructions in the manual one by one. Easy!

Just Kidding

Of course, translating machine code by hand is not a tenable strategy for making sense of a piece of software in any reasonable amount of time. In many cases, there are existing tools and software which can allow for the automation of this process, broadly referred to as “disassembly.” This is part of the function served by tools such as IDA and Binary Ninja, as well as the primary purpose of less complex utilities, such as the Unix command line tools “objdump.” However, as every ISA will encode machine instructions differently (by definition), someone, at some point, must do the initial work of automating translation between machine code and assembly the hard way for each ISA.

For popular architectures such as x86 and ARM, this work has already been done for us. These architectures are well supported by tools such as IDA and Binary Ninja by default, as well as the common executable file formats for these architectures, for example the Executable and Linkable Format (ELF) on linux and Portable Executable (PE) on Windows. In many cases, these architectures and formats will be plug-and-play, and you can begin reverse engineering your subject executable or firmware without any additional preperation or understanding of the underlying mechanisms.

But what do you do if your architecture and/or file format isn’t common, and is not supported out of the box by existing tools? This was a question I had to answer when working with the Blackfin processor referenced earlier. Not only was the architecture unfamiliar and uncommon, but the file format used by the operating system running on the processor was a fairly obscure one, binary FLAT (bFLT), sometimes used for embedded Linux systems without a Memory Management Unit (MMU). Additionally, as it turned out and will be discussed later, the version of bFLT used on Blackfin-based devices didn’t even conform to what little information is available on the format.

Working Smarter

The best option, when presented with an architecture not officially supported by existing tooling, is to use unofficial support. In some cases, some other poor soul may have been faced with the same challenge we are, and has done the work for us in the form a of a plugin. All major reverse engineering tools support some kind of plugin system, with which users of said software can develop and optionally share extra tooling or support for these tools, including support for additional architectures. In the case of Binary Ninja, the primary focus for this article, “Architecture” plugins provide this kind of functionality. However there is no guarantee that a plugin targeting your particular architecture will either exist, or work the way you expect. Such is open source development.

If such a convenient solution does not exist, the next step short of manually working from the reference manual requires getting our hands dirty and cannibalizing existing code. Enter the venerable libopcodes. This library, dating back at least to 1993, is the backbone that allows utilities such as objdump to function as they do. It boasts an impressive variety of supported architectures, including our target Blackfin. It is also almost entirely undocumented, and its design poses a number of issues for more extensive binary analysis, which will be covered later.

Using libopcodes directly from a custom disassembler written in C, we can begin to get some meaningful disassembly out of our example executable.

However, an issue should be immediately apparent: the output of this custom tool is simply text, and immutable text at that. No semantic analysis has or can take place, because of the way libopcodes was designed: it takes machine code supplied by the user, passes it through a black box, and returns a string which represents the assembly code that would have been written to produce the input. There is no structural information, no delineation of functions, no control flow information, nothing that could aid in analysis of binaries more complex than a simple “hello world.” This introduces an important distinction in disassembler design: the difference between disassembly and decomposition of machine code.

Disassembly

The custom software written above using libocpdes, and objdump, are disassemblers. They take an input, and return assembly code. There is no requirement for any additional information about a given instruction; to be a disassembler, a piece of software must only produce the correct assembly text for a given machine instruction input.

Decomposition

In order to produce correct assembly code output, a disassembler must first parse a given machine instruction for meaning. That is, an input sequence of ones and zeros must be broken up into its constituent parts, and the meaning of those parts must be codified by some structure which the disassembler can then translate into a series of strings representing the final assembly code. This process is known as decomposition, and for those familiar with compiler design, is something like tokenization in the other direction. For deeper analysis of a given set of machine instructions (for example a full executable containing functions) decomposition is much more powerful than simple disassembly.

Consider the following machine instruction for the Blackfin ISA:

Hex: 0xE2001000; Binary: 1110 0010 0000 0000 0001 0000 0000 0000

Searching the reference manual for instructions which match this pattern, we find the JUMP.L instruction, which includes all 32 bit values from 0xE2000000 to 0xE2FFFFFF. We also see in this entry what each bit represents:

We see that the first 8 bits are constant – this is the opcode, a unique prefix which the processor interprets first to determine what to do with the rest of the bits in the instruction. Each instruction will have a unique opcode.

The next 8 bits are marked as the “most significant bits of” something identified as “pcrel25m2,” with the final 16 bits being “least significant bits of pcrel25m2 divided by 2.” The reference manual includes an explanation of this term, which is essentially an encoding of an immediate value.

Based on this, the machine instruction above can be broken up into two tokens: the opcode, and the immediate value. The immediate value, after decoding the above instruction’s bits [23:0] as described by the manual, is 0x2000 (0 + (0x1000 * 2)). But how can the opcode be represented? It varies by architecture, but in many cases an opcode can be translated to an associated assembly mnemonic, which is the case here. The E2 opcode corresponds to the JUMP.L mnemonic, as described by the manual.

So then our instruction, 0xE2001000 translates into the following set of tokens:

Instruction {
    TokenList [
        Token {
            class: mnemonic;
            value: "JUMP.L";
        },
        Token {
            class: immediate;
            value: 0x2000;
        }
    ]
}

For a simple text disassembler, the processing of the instruction stops here, the assembly code JUMP.L 0x2000 can be output based on the tokenized instruction, and the disassembler can move on to the next instruction. However, for more useful analysis of the machine code, additional information can be added to our Instruction structure.

The JUMP.L instruction is fairly simple; the reference manual tells us that it is an unconditional jump to a PC-relative address. Thus, we can add a member to our Instruction structure indicating this: an “Operation” field. You can think of this like instruction metadata; information not explicitly written in the associated assembly, but implied by the mnemonic or other constituent parts. In this case, we can call the operation OP_JMP.

Instruction {
    Operation: OP_JMP;
    TokenList [
        Token {
            class: mnemonic;
            value: "JUMP.L";
        },
        Token {
            class: immediate;
            value: 0x2000;
        }
    ]
}

By assigning each instruction an Operation, we can craft a token parser which does more than simply display text. Because we are now encoding meaning in our Instruction structure, we can interpret each component token based on its associated meaning for that instruction specifically. Taking JUMP.L as an example, it is now possible to perform basic control flow analysis: when the analysis tool we are building sees a JUMP.L 0x2000, it can now determine that execution will continue at address PC + 0x2000, and continue analysis there.

Our Instruction structure can be refined further, encoding additional information specific to it’s instruction class. For example, in addition to the unconditional PC-relative jump (JUMP.L), Blackfin also offers conditional relative jumps, and both absolute and relative jumps to values stored in registers.

For conditionality and whether a jump is absolute or relative, we can add two more fields to our structure: a Condition field and a Relative field, as follows.

Relative unconditional JUMP.L 0x2000:

Instruction {
    Operation: OP_JMP;
    Condition: COND_NONE;
    Relative: true;
    TokenList [
        Token {
            class: mnemonic;
            value: "JUMP.L";
        },
        Token {
            class: immediate;
            value: 0x2000;
        }
    ]
}

Absolute unconditional to register JUMP P5:

Instruction {
    Operation: OP_JMP;
    Condition: COND_NONE;
    Relative: false;
    TokenList [
        Token {
            class: mnemonic;
            value: "JUMP";
        },
        Token {
            class: register;
            value: REG_P5;
        }
    ]
}

Conditional jumps appear more complex represented in assembly, but can still be represented with the same structure. CC is a general purpose condition flag for the Blackfin architecture, and is used in conditional jumps. The standard pattern for conditional jumps in Blackfin code looks like this:

CC = R0 < R1;
IF CC JUMP 0xA0;
...

Conditional relative IF CC JUMP 0xA0:

Instruction {
    Operation: OP_JMP;
    Condition: COND_FLAGCC;
    Relative: true;
    TokenList [
        Token {
            class: mnemonic;
            value: "JUMP";
        },
        Token {
            class: immediate;
            value: 0xA0;
        }
    ]
}

We do not need tokens for the IF and CC strings, because they are encoded in the Condition field.

All instructions can be broken down this way. Our decomposer takes machine code as input, and parses each instruction according to the logic associated with its opcode, producing a structure with the appropriate Operation, tokens and any necessary metadata such as condition, relativity, or other special flags.

Our initial categorization of instruction based on opcode looks like this:

And a simple example of decomposing the machine instruction (for the unconditional relative jump):

For more complex instructions, the decomposition code can be much more involved, but will always produce an Instruction structure conforming to our definition above. For example, the PushPopMultiple instruction [--SP] = (R7:5, P5:1) uses a rather complicated encoding, and more processing is required, but still can be represented by the Instruction structure.

The process of implementing decomposition logic can be somewhat tedious, given the number of instructions in the average ISA. Implementing the entirety of the Blackfin ISA took about a week and a half of effort, referencing both the Blackfin reference manual and the existing libopcodes implementation. The libopcodes opcode parsing logic was lifted nearly verbatim, but the actual decomposition of each instruction had to be implemented from scratch due to the text-only nature of the libopcodes design.

Analysis

Now we have our decomposer, which takes in machine instructions and outputs Instruction objects containing tokens and metadata for the input. I’ve said before “this information is useful for analysis,” but what does this actually mean? One approach would be to write an analysis engine from scratch, but thankfully a powerful system already exists for this purpose: Binary Ninja and its plugin system. We’ll be exploring increasingly more sophisticated analysis techniques using Binary Ninja, starting with recreating the basic disassembler we saw before (with the added perks of the Binary Ninja UI) and ending up with full pseudo-C decompiled code.

We’ll be creating a Binary Ninja Architecture Plugin to accomplish our goal here. The precise details for doing so are outside the scope of this article, but additional information can be found in this excellent blog post from Vector35.

Basic Disassembly

First, we’ll recreate the text-only disassembler from earlier in the article, this time as a Binary Ninja plugin. This can be accomplished by defining a function called GetInstructionText in our plugin, which is responsible for translating raw machine code bytes to a series of tokens for Binary Ninja to display. Using our jump Instruction structure again, the process can be represented in pseudocode as follows:

for token in Instruction.TokenList {
    switch (token.class) {
    case mnemonic:
        BinaryNinjaOutput.push(InstructionTextToken, token.value);
    case immediate:
        BinaryNinjaOutput.push(IntegerToken, token.value);
    etc...
    }
}

This step completely ignores the operation and metadata we assigned each object earlier; only the tokens are processed to produce the corresponding instruction text, in other words, the assembly. After implementing this, as well as the necessary Binary Ninja plugin boilerplate, the following output is produced:

Control Flow Analysis

This looks a bit nicer than the text disassembler, but is essentially serving the same function. The code is interpreted as one giant, several hundred kilobyte function with no control flow information to delineate functions, branches, loops, and various other standard software constructs. We need to explicitly tell Binary Ninja this information, but thankfully we designed our decomposer in such a way that it already supplies this information inside the Instruction structure. We can single out any Operation which affects control flow (such as jumps, calls, and returns) and hint to Binary Ninja about how control flow will be affected based on the constituent tokens of those instructions. This process is implemented in the GetInstructionInfo function, and is as follows:

With this implemented, the output is substantially improved:

We now have individual functions, and control flow is tracked within and between them. We can follow branches and loops, see where functions are called and where they call to, and are much better equipped to actually begin to make sense of the software we are attempting to analyze.

Now, we could stop here. This level of analysis combined with Binary Ninja’s built-in interactivity is more than enough to make reasonable progress with your executable (assuming you know the assembly language of your target executable, which you certainly will after writing a disassembler for it). However, the next step we’ll take is where Binary Ninja and its architecture plugins really shine.

Lifting and Intermediate Languages

At the time of its invention the concept of the assembler, which generates machine code based on human-readable symbolic text, was a huge improvement over manual entry of machine code by a programmer. It was made intuitive through the use of certain abstractions over manually selecting opcodes and allowed a programmer to use mnemonics and other constructs to more clearly dictate what the computer program should do. You could say that assembly is a higher level language than machine code, in that it abstracts away the more direct interactions with computer hardware in favor of ease of programming and program understanding.

So how might we improve the output of our plugin further? While certainly preferable to reading raw machine code, assembly language isn’t the easiest to follow way of representing code. The same kinds of abstractions that improved upon machine code can be applied again to assembly to produce a language at an even higher level, such as Fortran, C, and many others. It would be beneficial for our reverse engineering efforts to be able to read our code in a form similar to those languages.

One way to accomplish this is to design a piece of software which translates assembly to the equivalent C-like code from scratch. This would require a full reimplementation for every new architecture and is the approach taken by the Hexrays decompilers associated with IDA — the decompiler for each architecture is purchased and installed separately, and any architecture not explicitly implemented is entirely unsupported.

Another approach is available, and it once again takes its cue from compiler design (which I will be oversimplifying here). The LLVM compiler architecture uses something called an Intermediate Representation (IR) as part of the compilation process: essentially, it is the job of the compiler frontend (clang for example) to translate the incoming C, C++, or Objective-C code into LLVM IR. The compiler backend (LLVM) then translates this IR into machine code for the target architecture. Credit to Robin Eklind for the following image from this blog covering LLVM IR:

An important feature of this compiler architecture is its ability to unify many input languages into a single representational form (LLVM IR). This allows for modularity: an entire compiler need not be created for a new language and architecture pair, and instead only a frontend which translates that new language into LLVM IR must be implemented for full compilation capabilities for all architectures already supported by the LLVM backend.

You may already see how this could be turned around to become useful processing machine code in the other direction. If some system can be designed which allows for the unification of a variety of input architectures into a single IR, the heavy lifting for translating that representation into something more conducive to reverse engineering can be left to that system, and only the “front-end” must be implemented.

Allow me to introduce Binary Ninja’s incredibly powerful Binary Ninja Intermediate Languages, or BNIL. From the Binary Ninja documentation on BNIL:

The Binary Ninja Intermediate Language (BNIL) is a semantic representation of the assembly language instructions for a native architecture in Binary Ninja. BNIL is actually a family of intermediate languages that work together to provide functionality at different abstraction layers. BNIL is a tree-based, architecture-independent intermediate representation of machine code used throughout Binary Ninja. During each analysis step a number of optimizations and analysis passes occur, resulting in a higher and higher level of abstraction the further through the analysis binaries are processed.

Essentially, BNIL is something akin to LLVM IR. The following flow chart is a rough representation of how BNIL is used within Binary Ninja:

The portion of an Architecture plugin that produces the Lifted IL as described by that chart is known as the lifter. The lifter takes in the Instruction objects we defined and generated earlier as input, and based on the operation, metadata, and tokens of each instruction describes what operations are actually being performed by a given instruction to Binary Ninja. For example, let’s examine the process of lifting the add instruction for the ARMv7 architecture.

Assembly:

add r0, r1, 0x1
Instruction object resulting from decomposition:

Instruction {
    Operation: OP_ADD;
    TokenList [
        Token {              // Instruction mnemonic
            class: mnemonic;
            value: "add";
        },
        Token {              // Destination register
            class: register;
            value: REG_R0;
        },
        Token {              // Source register
            class: register;
            value: REG_R1;
        },
        Token {              // Second source (here immediate value)
            class: immediate;
            value: 0x1;
        }
    ]
}

Based on the assembly itself, the ARM reference manual, and our generated Instruction object, we understand that the operation taking place when this instruction is executed is:

Add 1 to the value in register r1
Store the resulting value in register r0

Now we need some way of indicating this to Binary Ninja. Binary Ninja’s API offers a robust collection of functions and types which allow for the generation of lifted IL, which we can use to this end.

Relevant lifter pseudo-code (with simplified API calls):

GetInstructionLowLevelIL(const uint8_t *data, uint64_t addr, size_t &len, LowLevelILFunction &il) {
    Instruction instr = our_decompose_function(data, addr);
    switch (instr.Operation) {
    ...
    case OP_ADD:
        REG dst_reg = instr.TokenList[1];
        REG src_reg = instr.TokenList[2];
        int src2    = instr.TokenList[3];
        il.AddInstruction(
            il.SetRegister(
                il.Register(dst_reg)
                il.Add(
                    il.Register(src_reg), 
                    il.Const(src2)))
        );
    ...
    }
}

The resulting API call reads “set the register dst_reg to the expression ‘register src_reg plus the constant value src2‘”, which matches the description in plain english above.

If after completing the disassembly portion of your architecture plugin you found yourself missing the abject tedium of writing an unending string of instruction decomposition implementations, fear not! The next step in creating our complete architecture plugin is implementing lifting logic for each distinct Operation that our decomposer is capable of assigning to an instruction. This is not quite as strenuous as the decomposition implementation, since many instructions are likely to have been condensed into a single Operation (for example, Blackfin features 10 or so instructions for moving values into registers; these are all assigned the OP_MV Operation, and a single block of lifter logic covers all of them).

Once the lifter has been implemented, the full power of Binary Ninja is available to us. In the Binary Ninja UI, we can see the lifted IL (on the right) our plugin now generates alongside the disassembly (on the left):

You’re forgiven for thinking that it is a bit underwhelming for all the work we’ve put in to get here. However, take another look at the Binary Ninja analysis flow chart above. Now that our plugin is generating lifted IL, Binary NInja can analyze it to produce the higher-level IL representations. For reference, we’ll be looking at the analysis of a Blackfin executable compiled from the following code:

int
add4(int x, int y, int z, int j)
{
    return x + y + z + j;
}

int
main()
{
    int x, y, z, j;
    x = 1;
    y = 2;
    z = 3;
    j = 0x12345678;
    return add4(x, y, z, j);
}

Finally, let’s take a look at the high-level IL output in the Binary Ninja UI (right), alongside the disassembly:

As you might guess, reverse engineering the code on the right can be done in a fraction of the time it would take to reverse engineer pure assembly code. This is especially true for an obscure architecture that might require frequent trips to the manual (what does the link instruction do again? Does call push the return address on the stack or into a register?). Furthermore this isn’t taking into account all of the extremely useful features available within Binary Ninja once the full analysis engine is running, which increase efficiency substantially.

So, there you have it. From zero knowledge of a given architecture to easily analyzable pseudo-C in about two weeks, using just some elbow grease and Binary Ninja’s excellent BNIL.

Keen readers may have noticed I carefully avoided discussing a few important details — while we do now have the capabilities to produce pseudo-C from raw machine code for the Blackfin architecture, we can’t just toss an arbitrary executable in and expect complete analysis. A few questions that still need to be answered:

  1. What is the function calling convention for this platform?
  2. Are there syscalls for this platform? How are they handled?
  3. What is the executable file format? How are the segments loaded into memory? Are they compressed?
  4. Where does execution start?
  5. Is dynamic linking taking place? If so, how should linkage be resolved?
  6. Are there relocations? How are they handled?

Since this article is already a mile long, I’ll save exploration and eventual answering of these questions for an upcoming Part 2. As a preview though, here’s some fun information: Exactly none of those questions have officially documented answers, and the unofficial documentation for the various pieces involved, if it existed in the first place, was often outright incorrect. Don’t put away that elbow grease just yet!

References

RESEARCH | March 16, 2022

Wideye Security Advisory and Current Concerns on SATCOM Security

In accordance with our Responsible Disclosure Policy1, we are sharing this previously unpublished, original cybersecurity research, since the manufacturer of the affected products in the Wideye brand, Addvalue Technologies Ltd., has been non-responsive for more than 3-years after our initial disclosure and we have seen similar vulnerabilities exploited in the wild during the War in Ukraine.2 IOActive disclosed the results of the research back in 2019 and successfully connected with AddValue Technologies Ltd, the vulnerable vendor. Unfortunately, we have not received any feedback from the manufacturer after providing the coordinated, responsible disclosure of the report in 2019.

Depending on where in the world you live or work, you may be familiar with satellite internet. A variety of equipment and services exist in this field, ranging from large-scale static installations to smaller, portable equipment for use in the field or where larger installations are not possible. Satellite internet systems also make connectivity and communication possible under circumstances where traditional communication infrastructure is unavailable due to natural disaster, isolation, or deliberate disruption. In such situations, maintaining availability and ensuring these systems are well secured is of vital importance.

IOActive and others have done work on commercial satellite communication (SATCOM) terminals. Unfortunately, we have yet to see a significant improvement in this industry’s security posture. Back in 2014,3 Ruben Santamarta presented the findings documented in a whitepaper titled “A Wake-Up call for SATCOM Security.” In 20184 he presented another whitepaper, “Last Call for SATCOM Security,” where he shared a plethora of vulnerabilities and real-world attack scenarios against multiple SATCOM terminals across different sectors. These dense, extensively referenced whitepapers, include an introduction to SATCOM architecture and threat scenarios, as well as definitions of some key technical terms.

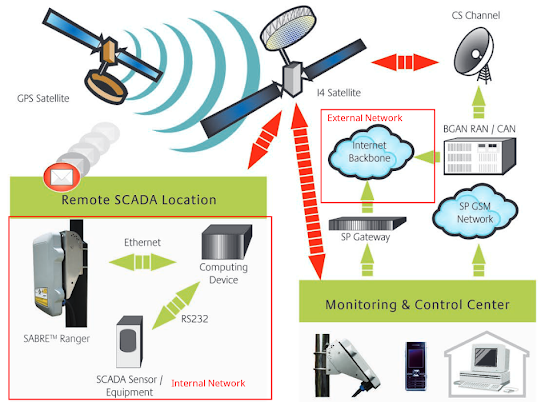
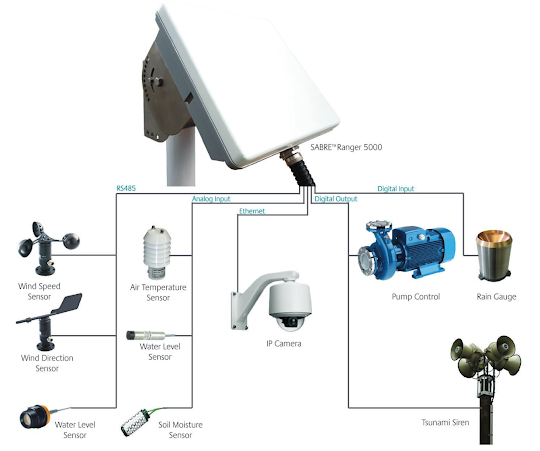
The iSavi5 and SABRE Ranger 50006 Satellite Terminals, produced by Wideye7, were included in IOActive’s SATCOM research. iSavi is an affordable, personal satellite terminal developed for Inmarsat’s8 IsatHub service. It is lightweight, highly portable, and quick and easy to set up with no technical expertise or training needed. iSavi is intended as a personal device and may not have a publicly accessible IP address. The SABRE Ranger 5000 is a compact machine-to-machine (M2M) satellite terminal. It is intended to be connected 24/7, provides remote access to equipment, and is used in SCADA applications.

IOActive conducted a black-box security assessment of these two devices in order to identify their attack surfaces and determine their overall security posture. This included dynamic penetration testing using both industry-standard techniques as well as tools and techniques developed by IOActive. Dynamic testing included network and physical interfaces. Additionally, we performed static analysis of device firmware, consisting of binary reverse engineering and review.

IOActive identified numerous security issues, spanning multiple domains and vulnerability classes. Several the identified vulnerabilities have the potential to lead to full or partial device and communication compromise, as well as leak information about components of the system, including GPS location coordinates, to unauthorized parties. The issues can be grouped in the following broad categories:

  1. Authentication and Credential Management
  2. Data Parsing
  3. Networking
  4. Firmware Security
  5. Information Disclosure

IOActive found the overall security posture of the Wideye iSavi and Ranger systems to be poor. In some areas, attempts were made to secure the devices, but these attempts proved inadequate. In other areas, no attempts were made at all, even in areas where specific threats are well established in the realm of device security.

IOActive provided coordinated, responsible disclosure to the manufacturer in 2019, but have not received any feedback after numerous attempts.

As it has been more than three years and there is clear, public information that vulnerabilities in SATCOM terminals are actively being exploited by nation-state threat actors,9 we believe it is in the best interests for us to disclose this information so that all stakeholders can make informed risk decisions and respond to these threats.

As of the posting of this blog entry, IOActive has confirmed that all the initially disclosed vulnerabilities are still present in the most current, publicly available firmware images from the Wideye website.

Due to these heightened risks, IOActive will be releasing the full details of the vulnerabilities in both the iSavi and Ranger 5000 satellite terminals in approximately 14-days.

We are offering the additional two-week window to allow impacted stakeholders to assess their risks and put compensating controls in place.

You can read additional details about our decision to publicly disclose this research in the blog post here.


INSIGHTS, RESEARCH | February 8, 2022

Biometric Hacking: Face Authentication Systems

In our Biometric Testing Facility, we have conducted a large number of security assessment of both 2D and 3D-IR Based face authentication algorithms.

In this post, we introduce our Face Recognition Research whitepaper where we analyzed a number 2D-based algorithms used in commercially available mobiles phones. We successfully bypassed the facial authentication security mechanism on all tested devices for at least one of the participating subjects.

If you want to have a better understanding of the environment and type of tests performed to achieve these results, please refer to the following document: Face Recognition Research

Tested Devices

The devices used in this research were a Samsung Galaxy S10+, OnePlus 7 Pro, VIVO V15 Pro, Xiaomi Mi 9, and Nokia 9 Pure View with the characteristics shown below.

Test Parameters

Subjects

We used subjects of various ethnicities: two Asian (male and woman), two African American (male and female), and one Caucasian (male).

Note that while we have subjects of three different ethnicities, the sample size is not sufficiently large enough to conclusively identify a statistically significant causal relationship between ethnicity and success rate.

Black-Box 2D Test Results

The following table illustrates the unlock probability observed during black-box testing using the following color code (red: reliable unlock, orange: occasional unlock, green: no unlock) 

Again, while this sample size is insufficient to produce a statistically significant link between ethnicity and unlock success rate, it does indicate additional investigation is warranted.

Case Study: OnePlus 7 Pro

In addition to the above results, further analysis was conducted on the OnePlus 7 Pro, for the sake of understanding how the different subsystems are glued together. More information can be found in the Face Recognition Research whitepaper.

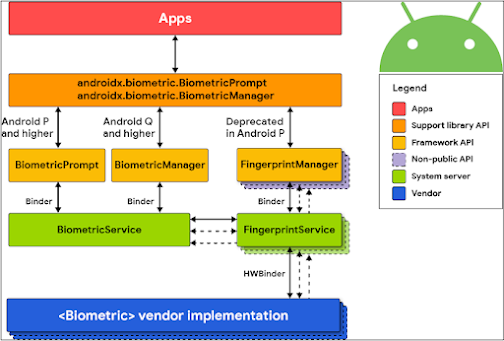
The basic Architecture implements the following basic components: 

There are three interesting components that are useful for our goals:

1. App: Each vendor has its own Android application whose main function is to collect images, extract the facial features they consider interesting, and manage all the lock/unlock logic based on an IA model

2. BiometricManager: This is a private interface that maintains a connection with BiometricService.

3. Biometric vendor implementation: This must use secure hardware to ensure the integrity of the stored face data and the authentication comparison.

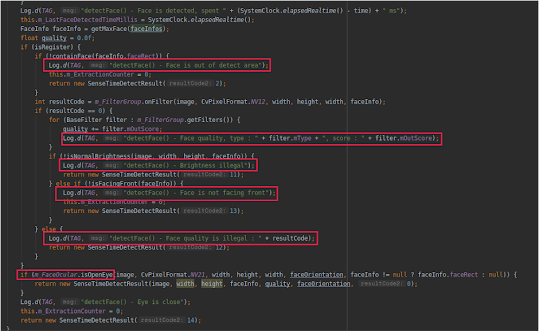
Looking into the application, we can spot the basis for face detection (full face in the image, quality, brightness, front facing, and opened eyes):

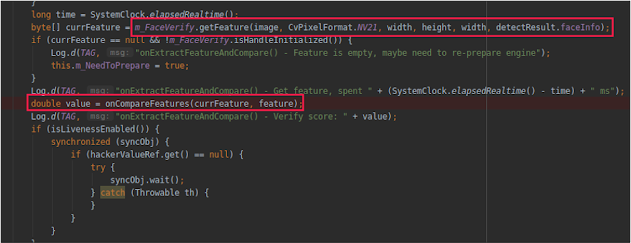
The following excerpt shows the most important part, extracting image features and comparing them to enrolled subject’s facial data.

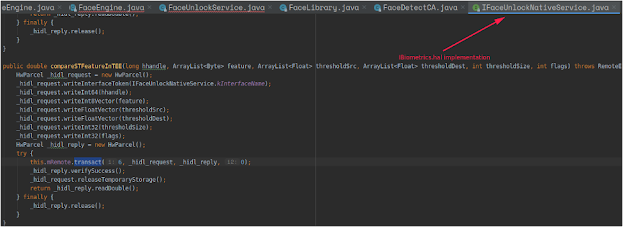
Continuing our analysis, we find IFaceUnlockNativeService (BiometricManager) which is the interface that will talk to the TEE hardware environment. 

Once the match score is received, if it is a positive match and hackerValue is less than 0.95, the check process is completed, and the phone will be unlocked.

Additional Observations

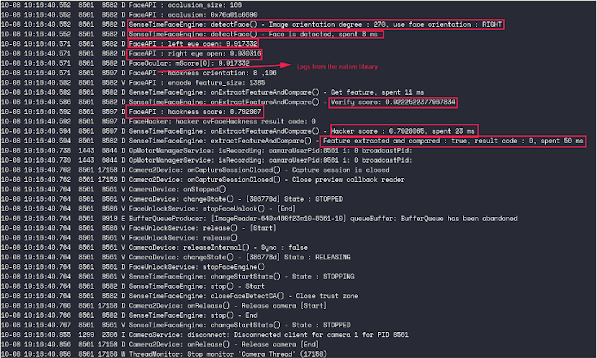
We observed that the code contains numerous log calls. This makes our task easier by disclosing useful information in real time while the phone is evaluating a face, which weren’t use during the results shown above.

adb logcat | grep “$(adb shell ps | grep com.oneplus.faceunlock | awk ‘{print $2}’)”

Output: 

Conclusions

The use of facial recognition systems has become pervasive on mobile phones and is making inroads in other sectors as the primary method to authenticate the end user of a system. These technologies rely on models created from an image or facial scan and selecting specific features that will be checked in a live environment against the actual user or an attacker. The algorithms need be accurate enough to detect a spoofing attempt, but flexible enough to make the technology useful under different lighting conditions and accommodate normal physical changes in the legitimate users.

As has been shown in this blog post, the technologies behind facial recognition have room for improvement. A number of techniques have been used to successfully bypass these algorithms and there is plenty of room for additional creative attack methods. System architects should carefully consider the risks of employing facial recognition systems for authentication in their systems and evaluate using more robust authentication methods until this technology matures.As has been shown in this blog post, the technologies behind facial recognition have room for improvement. A number of techniques have been used to successfully bypass these algorithms and there is plenty of room for additional creative attack methods. System architects should carefully consider the risks of employing facial recognition systems for authentication in their systems and evaluate using more robust authentication methods until this technology matures.

INSIGHTS, RESEARCH | January 22, 2022

How we hacked your billion-dollar company for forty-two bucks

subvert (v) : 3. To cause to serve a purpose other than the original or established one; commandeer or redirect: – freedictionary.com

Why did one straw break the camel’s back?
Here’s the secret
The million other straws underneath it
– Mos Def, Mathematics

The basic idea of this blog post is that most organizations’ Internet perimeters are permeable. Weaknesses in outward-facing services are rarely independent of one another, and leveraging several together can often result in some sort of user-level access to internal systems.

A lot of traffic goes in and out of a normal company’s Internet perimeter: email comes in and goes out, web traffic from customers or potential customers comes in, web traffic for internal users goes out, and lots of necessary services create traffic, such as Citrix remote desktop, web authentication (especially password resets), helpdesk services, file exchange and more. The question is, can we make use of combinations of seemingly minor problems to access internal systems? The answer is mostly, yes.

To substantiate the admittedly clickbait-y title (it was delivered as a talk at B-Sides London), we spent eight dollars a month on a Linux VPS and occasionally bought a .com domain for 10 bucks. In fact, the biggest single expenditure was on coffee.All domain names have been anonymized below; if the ones I have given exist, they are not the entity I am describing. Obviously, all of this was done at the request of the particular entity, in order to find weaknesses so they could be fixed.

Definitions

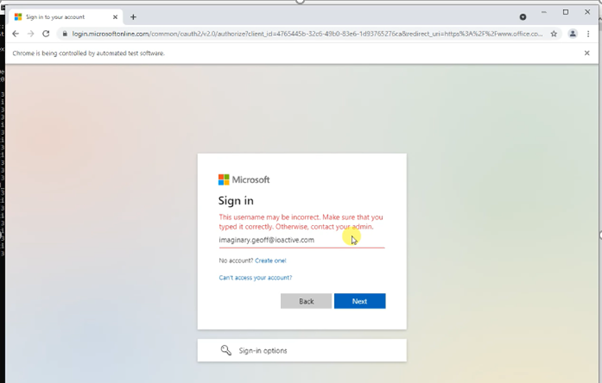
‘Username enumeration’ is the term used when a function confirms whether a username is valid or not. For example, password reset processes that tell you a username doesn’t exist. A difference in response time will also do, if consistent enough—it doesn’t have to be explicit. However, office.com logins tell you clearly: “This username may be incorrect … “

‘Password spraying’ refers to checking one password against lots and lots of users, so that by the time you come back to a user to try a new password, any account lockout counters have been reset. For example, trying “Spring2022!” against jeff@example.com and dave@example.com, etc. Of course, there may be rate limits on guesses, as well as account lockout policies, and if so, we will need to deal with that.

Tahi.com

Initially, we used an OSINT tool called FOCA (https://www.elevenpaths.com/innovation-labs/technologies/foca) to find any metadata in published documents. FOCA will search and download files like PDFs and Word docs, and look for properties like ‘author’ or ‘operating system’ or anything that may be of interest to an attacker. This didn’t result in much, apart from a few things that might be user IDs of the form ‘ID01234567’.

On the perimeter, we noticed the helpdesk web page allowed user enumeration, but this was pretty slow and would need special scripting to exploit in bulk. It helped confirm that the information we’d found were user IDs, but it wasn’t ideal for large-scale harvesting.

As the target exposed OWA, we used MailSniper (https://github.com/dafthack/MailSniper), and in particular, Invoke-UsernameHarvestOWA to confirm valid user IDs in a large block surrounding the IDs we had found with FOCA. This resulted in a couple of thousand users in the particular range, and from there, we moved on to using Invoke-PasswordSprayOWA from the same package.

PS MailSniper> Invoke-PasswordSprayOWA -ExchHostname mail.tahi.com -UserList .\userlist.txt -Password Spring2021! -Threads 5 -OutFile sprayed-owa-creds.txt

We started using MailSniper to enumerate on 16th of the month, kept it running pretty much continuously doing one thing or another, and by the 22nd we had obtained passwords for two users.

OWA did not have two-factor authentication (2FA) enabled, so we had access to two email accounts, and internal mail filtering is a lot less restrictive than for mail coming in from outside. That means we can do something like send a custom implant in reply to a real email and ask the victim to run it.

In this case, the problems were: having guessable usernames and guessable passwords at the same time and not enforcing 2FA for all services.

Rua.com

Again, we used FOCA to establish a few examples, in this case, some combination of first and last name, like “jsmith.” We downloaded common US surnames (https://americansurnames.us/top-surnames) and made a list of likely candidates with common first initials and last names. This can be done with a simple bash one-liner.

MSOLSpray.py (https://github.com/MartinIngesen/MSOLSpray) is a Python implementation of a tool called MSOLSpray (https://github.com/dafthack/MSOLSpray) implemented in PowerShell. As I prefer using Python tooling, I picked this one to try out the various candidate usernames against the Microsoft Online login—the same thing you authenticate to when logging in to office.com, for example. In this case, we also used a tool called Fireprox (https://github.com/ustayready/fireprox) to rotate the source IP address and evade any rate-limiting controls based on source IP.

Some manual checks of the initial results showed that it was not a straightforward login once a username had been correctly guessed; there was then a web redirect to an on-premise Identity Provider (IdP). In this case, MSOLSpray.py (and I think the original MSOLSpray) determines the existence correctly but does not confirm the correct password. So we needed to figure out how to fix that.

People who do any sort of work testing websites may have come across a tool called Selenium (https://selenium-python.readthedocs.io/)–this enables a script written in Python, for example, to drive the browser through a set process and allows the script to query information back from the web pages. After some hours of scripting, it was possible to get Selenium/Python/Chrome to walk through the login process from start to finish and distinguish between valid users with the correct password, valid users with the wrong password, and users that do not exist. The whole thing took maybe 30 seconds per try on average, so while not quick, it was eminently feasible—and remember, MSOLSpray.py had at least confirmed which usernames existed.

Figure 1 – using Selenium’s WebDriver to enter information into web pages

Using Selenium, we got correct passwords for around 10 users. 2FA had been enabled with registration on first login, but the nature of business meant a lot of staff had never logged in and thus had not registered their own 2FA tokens.

We registered our own 2FA token against some of these accounts and logged in to a Citrix desktop. From there, we could deploy a custom implant directly, as well as query AD for configuration weaknesses with tools such as BloodHound.

Again, having guessable passwords combined with not having fully configured 2FA for everyone allowed us to gain access.

Toru.com

We had already guessed two sets of credentials for toru.com but needed more privileges.

Exploring the perimeter led to the discovery of a website where people book time off from work, which seemed to have an open URL redirect; that is, it did not validate the url parameter correctly for redirecting after a successful login.

We hosted a cloned page, but with a “wrong password” error already on it. The phishing email we sent gave a legitimate page address but with ?url=<phishing site>:

https://pto.toru.com/login?url=https://pto-toru.com/phishing  

Users would get “[EXTERNAL]” in the subject line, but the link was obviously to their own site.

The real site took the username and password and would redirect to the cloned page on successful login. The cloned site reported “wrong creds, please retry”, and then redirected back to the original, valid logged-in session that had been established.

No one even noticed they’d been phished.

Despite the fact that IT had blocked the URL on the corporate proxy (thanks to a service that looked out for domain typo-squatting), we still got 10 or so sets of credentials from people using their own devices at home.

Again, toru.com did not use 2FA for OWA, so we could access more email accounts and find a good reason for someone to execute our implant, attached to an internal only email.

Rima.com

Rima.com used hybrid AD, so again we could do password spraying against Microsoft Online with MSOLSpray.py and Fireprox.

User IDs were also numeric (i.e. “A01234567”).

We found a few passwords (in the form MonthYear or SeasonYear!), but it initially looked like everything required 2FA; however, the very useful MFASweep tool (https://github.com/dafthack/MFASweep) discovered the ActiveSync mail protocol was an exception.

Once we knew this, we could use Windows 10 Mail to send emails from a compromised user to another user – including executable attachments.

Key Takeaways

In all four cases, we managed to get some way of executing code inside the perimeter – and then could proceed to the “normal” red team activities of dropping Cobalt Strike implants and exploring inside the organisation.A combination of “minor” issues can be very serious indeed. Remember that CVSS2 does not consider interactions between different issues, so a CVSS “medium” like open URL redirect might need an urgent fix.

User enumeration exists in a lot of different places on most perimeters; any instance of it will do for an attacker.

Red Team

Password spraying is a numbers game; aim for a thousand usernames if you can, but the more the better.

Bigger and/or older companies can actually be easier targets because they have larger attack surfaces.

Although a red team is by no means an audit, such an exercise is certainly a worthwhile avenue of attack, and at worst, it’s something to leave running in the background while you do the cool Cobalt Strike implant stuff.

Blue Team

Log everything. Monitor everything. It will come in useful at some point.

Weak passwords need to be changed proactively.

Aim to use 2FA across all services. No exceptions.

Keeping an inventory of all hosts and turning off obsolete services is a really good idea.

While I don’t normally recommend expiring passwords, it can help if you are strengthening your password policy, as weaker passwords will age out. Obviously, just the standard Windows policy of ‘at least 3 of 4 character classes’ will not do, because “Summer2022!” meets it; try to stop people setting passwords based on dictionary words and keyboard patterns.

“Honeypots” can be quite useful. For example, you can create a VM which has RDP privileges for everyone—BloodHound will pick this up. You know any logins to that VM are, at best, unnecessary and, at worst, an attacker probing for AD weaknesses. Equally, you can create a service account with an SPN so that the password hash can be recovered via kerberoasting. If no one should be using it, any time anyone logs in to the account, it is likely bad news.

INSIGHTS, RESEARCH | December 6, 2021

Cracking the Snapcode

A Brief Introduction to Barcodes

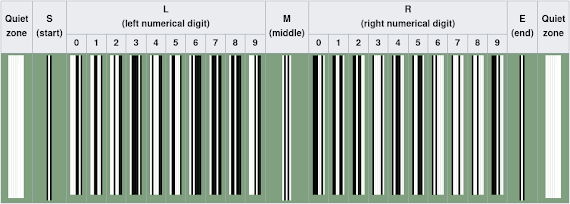
Barcodes are used everywhere: trains, planes, passports, post offices… you name it. And just as numerous as their applications are the systems themselves. Everybody’s seen a UPC barcode like this one:

But what about one like this on a package from UPS? 

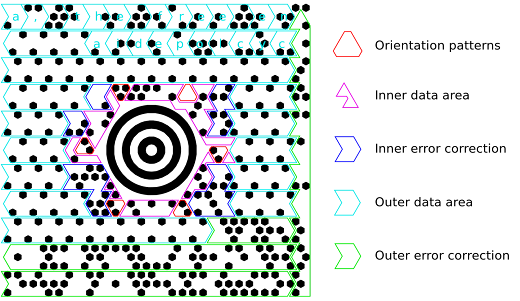
This is a MaxiCode matrix, and though it looks quite different from the UPC barcode, it turns out that these systems use many common techniques for storing and reading data. Both consist of black or white “modules” which serve different purposes depending on their location. Some modules are used to help with orientation when scanning the barcode, some act as data storage, and some provide error correction in case the modules are obscured. (I won’t address how the error correction algorithms work, but those who are interested can read more here [3].)

The diagram above shows the orientation patterns used in UPC barcodes to designate the start, middle, and end of the barcode, as well as how the data-storage modules are encoded. The last digit of a UPC barcode is not used to store data, serving instead as a checksum to verify that no errors were made when printing or reading the barcode. 

Though they look quite different, MaxiCode matrices employ the same mechanisms:

I want to stop here for a moment and just appreciate the intricacy of this system. The tinkerer in me can’t help but wonder, How could someone possibly figure all this out?For better or for worse, there is no need to figure it out since MaxiCode is public domain and Wikipedia has all the answers. But wouldn’t that be an interesting puzzle? 

If you answered no, here’s a QR code for your troubles:

For those of you still reading, I’d like to introduce another barcode system, and the guest of honor in today’s adventure: Snapcode.

Snapcode is a proprietary 2D barcode system that can trigger a variety of actions when scanned in the Snapchat app. Snapcodes can add a friend, unlock image filters, follow a link, and more. Unlike MaxiCode, however, there is no public documentation about how the Snapcode system works! Thus the scene is set. Driven merely by curiosity, I set out to answer the following questions: 

1. What data do Snapcodes encode?

2. How do Snapcodes encode data?

3. What actions can be triggered when these codes are scanned?

Chapter 1: Our Adventure Begins

The Tale of the Treasure

The first question I had to answer was, Is it even possible? Figuring out how Snapcodes encode data is impossible without first knowing what data they encode. In the hopes of uncovering a reliable correlation between the data underlying a Snapcode and the Snapcode itself, I generated the following URL Snapcodes that would navigate to the same address when scanned. If the Snapcodes store the URL directly, then they should look very similar.

To aid in the process of ingesting these images, I wrote a simple Python script that I will reference periodically throughout this tale [6]. The “scan” method checks each position that could contain a dot and stores it as a 1 (present) or 0 (empty) in a 2D array. This allowed me to efficiently ingest, process, and visualize the data, like in the image below. This image was generated by putting a black dot where both Snapcodes had a dot, a white dot if neither Snapcode had a dot, and red if one had a dot and the other did not:

This first trial showed quite a few red dots, suggesting that there may not be any connection between the Snapcode and the URL it represents. Hoping for a clearer correlation, I tried another type of Snapcode which adds a user as a friend when scanned. Repeating the experiment with the add-friend Snapcodes of two users with similar names (“aaaac123456789” and “aaaad123456789”) showed a more promising result.

Generating the same type of secondary Snapcode gave the following matrix:

The top and bottom show quite a bit of red, but take a look at the regions just to the left and right of the center. There is almost no red! From this, I drew two conclusions. First, the add-friend Snapcodes store, potentially among other data, some form of the username. Second, the dots to the left and right of the center are the ones used to encode this data, since this is where the highest correlation occurs. 

There is still a long way to go, but we have taken an important first step. Fundamentally, we know that there is in fact something to find within these dots, and on top of that, the fact that we know what is being stored may help us down the line.

What’s Below Deck?

In addition to the Snapcodes, another area to explore was of course the Snapchat app. Just from playing around with the app, I knew that it had the ability to generate and read these codes, so perhaps a closer look would uncover something useful to my pursuit. Using the Android Debug Bridge [7], I pulled the Android package file (APK) from a phone with Snapchat installed. An APK is a ZIP file that contains many different types of information, but of greatest interest to me was the compiled Java code. From the many tools available to decompile the code and reverse engineer the app, I chose to use JADX [8].

After some time poking around the decompiled Java code, I found that the app referenced several methods from a Java Native Interface (JNI) library used to produce the Snapcode images. This library was packaged along with the compiled Java files and provided the following functions that can be called from Java code:

String nativeGenerateWithVersion(long j, int i, byte[] bArr);

String nativeGenerateDotsOnlyWithVersion(long j, int i, byte[] bArr);

These methods took (among other arguments) a byte array containing the underlying data, and returned an SVG image of the Snapcode. If I could call these methods with data that I controlled, perhaps I could determine what exactly each of the dots means.

Chapter 2: The Treasure Map

As any treasure-hunter knows, it’s important to be lazy resourceful. Snapchat was kind enough to provide all the code I needed to construct a map: the Snapcode library, the logic to load it, and the method signatures to create the Snapcode images. A little paring down and I had my very own Android app [9] that could create Snapcodes with any data I wanted. The question was, What data?

Some helpful error messages told me that each Snapcode stored 16 bytes of data, presumably mapping to 16 groupings of eight dots. To light these byte-groups up one at a time, I passed the function an array with one byte set to -1 (which Java represents as b11111111 using two’s complement) and the rest set to 0. The result was a sequence of Snapcodes with one of these groupings lit up at a time.

Notice that some groups of dots are always present, some light up only once throughout the set, and some turn off and on sporadically. It seems plausible that these regions are respectively acting as orientation patterns, data storage, and error correction, just as we saw in the UPC and MaxiCode standards. To more clearly show the byte groupings, the orientation patterns and error correction dots have been removed:

A different set of byte arrays can be used to determine the order of the dots within each of these groupings: setting one bit in each byte to 1 and the rest to 0. This can be achieved with a series of byte arrays with each byte in the array being set to the same power of 2. For example, the array is filled with all 1s (b00000001) to identify the lowest bit in each byte, all 2s (b00000010) for the second bit, all 4s (b00000100) for the third bit, and so on.

Pieced together correctly, these two sets of data provide a perfect map between a Snapcode and the bit-string of data it represented. From the first set of Snapcodes, we identified the grouping of bits that made up each byte as well as the order of the bytes. From the second, we learned the ordering of the bits within each byte. The dot corresponding to bit X of byte Y, then, would be the dot that is present in both Snapcode Y of the first set (groupings) and the Snapcode X of the second set (orderings).

For my script, this map took the form of a list of coordinates. The bit-string was constructed by checking the corresponding positions in the Snapcode grid one by one, adding a value of 1 to the bit-string if there was a dot in that position and a 0 if not.

DATA_ORDER = [(16,5), (17,6), (17,5), (16,6), (18,5), (18,6), (0,7), (1,8), (1,7), (0,8), (2,7), (2,8), (16,3), (17,4), (17,3), (16,4), (18,3),(18,4),(0,5),(1,6), (0,6), (1,5), (2,6), (2,5), (4,16), (5,17), (5,16), (4,17), (4,18), (5,18), (4,0), (5,1), (4,1), (5,0), (4,2), (5,2), (16,16), (17,16), (16,17), (17,17), (16,18), (18,16), (16,0), (17,1), (16,1), (17,2), (16,2), (18,2), (14,16), (15,17), (14,17), (15,18), (14,18), (15,16), (14,0), (15,1), (14,1), (15,2), (14,2), (15,0), (0,3), (1,4), (1,3), (0,4), (2,3), (2,4), (12,16), (13,17), (12,17), (13,18), (12,18), (13,16), (12,0), (13,1), (12,1), (13,2), (12,2), (13,0), (8,16), (9,17), (8,17), (9,18), (8,18), (9,16), (8,0), (9,1), (8,1), (9,2), (8,2), (9,0), (3,13), (4,14), (3,14), (3,15), (4,15), (5,15), (3,3), (4,3), (3,4), (4,4), (3,5), (5,3), (15,13), (14,14), (15,14), (13,15), (14,15), (15,15), (13,3), (14,4), (15,3), (14,3), (15,4), (15,5), (10,16), (11,17), (10,17), (11,18), (10,18), (11,16), (10,0), (11,1), (10,1), (11,2), (10,2), (11,0), (0,2), (1,2)]

Reordering the dot matrix (a 2D array of 1s and 0s) into a bit-string using this data structure looked something like this:

def reorder_bits(dots):
    return [dots[row][col] for (row,col) in DATA_ORDER]

It wasn’t exactly pretty, but the pieces were coming together. At this point, I knew the add-friend Snapcodes somehow stored the username, and I knew how to reorder the dots into a series of bits. The final transformation, how those bits were being decoded into characters, was all that remained.

Chapter 3: Lost at Sea

Making Headway?

The methodology from here was a bit fuzzy. I created an account with the desired username, fed the account’s Snapcode into my script, and out popped a string of 1s and 0s for me to… do something with. As in the previous phase, the choice of input was the crux of the matter. I began with usernames that seemed interesting on their own, like ones consisting of a single character repeated many times. The first two usernames, “aaaaaaaaaaaaa4m” and “zzzzzzzzzzzzz4m”, had the respective bit-string representations:

01000000100000000000001100000000010000000101000100010100010001010101000100010100010001010101000100010100010001010010000100101100 
00000000000000000000001010000001011000000001110011000111011100010001110011000111011100010001110011000111011100010010010000101100

Staring at 1s and 0s, hoping to find something, was a particular kind of fun. You can’t help but see patterns in the data, but it can be difficult to know whether they are just in your imagination or if you are really on to something. If you’d like, take a few minutes and see what you can find before reading on. What I took away from this first experiment was the following:

...[010100010001010001000101][010100010001010001000101][010100010001010001000101]0010000100101100

...[000111001100011101110001][000111001100011101110001][000111001100011101110001]0010010000101100

The only patterns that I could identify appeared in the last 88 bits of the string. Both strings had a sequence of 24 bits (bits 41 to 64, in bold) that repeated three times followed by a sequence of 16 bits (underlined). 14 of these last 16 bits were the same between the two bit-strings. I also noticed that a similar pattern could be found in the usernames:

[aaaa][aaaa][aaaa]a4m 
[zzzz][zzzz][zzzz]z4m

Finding patterns in the bit-string was exciting on its own, but finding matching patterns in the two representations of the data suggested the presence of a clear path forward in converting the bits to characters. However, try as I might to find a connection, these patterns led nowhere. Every one of my (sometimes hair-brained) theories on how these bits may have been converted to letters proved fruitless.

Where Are We?

Having hit a dead end, I changed my tack and tried to learn more about what constituted a valid Snapchat username. According to Snapchat’s documentation [10], usernames must consist of 3-15 characters chosen from an alphabet of 39: lowercase letters, digits, and the three symbols “.”, “-“, and “_”. Furthermore, they must begin with a letter, end with a letter or number, and contain at most one non-alphanumeric character. 

A little math shows that representing a single character from this 39-letter alphabet would require six bits, since 2^5 (32) < 39 < 2^6 (64). 15 characters, then, would require 90 bits. However, as far as I could tell, these 15 characters were being encoded in the 88 bits where I noticed the patterns. No other similarities showed up in the two bit-strings. How else could they be encoded, if not separately using six bits per character?

As some background research had turned up, one of the encoding schemes used in the QR code standard solves a similar problem. Using an alphabet of 45 characters, QR’s alphanumeric encoding scheme [11] treats pairs of characters as two-digit base-45 numbers and encodes the resulting value into binary. The result is two characters per 11 bits, rather than one per six bits! Hypothesizing that the creators of the Snapcode system may have done something similar, I tried each of the possible permutations for decoding sets of X bits into N characters using an alphabet of size 39, but none of them created strings that showed any pattern like the underlying username. 

This was just one of many rabbit holes I went down. I learned a great deal about other barcode encoding schemes and came up with many ways the engineers may have optimized the usage of those 88 bits, but with regards to decoding the Snapcode I was dead in the water.

Chapter 4: ‘X’ Marks the Spot

Land, Ho!

With a strategy as fuzzy as “staring at bits,” it should be no surprise that the final breakthrough came when I found a way to better present the data on which I was relying. Snapchat provides a mechanism for generating new Snapcodes and deactivating old ones, in case an old Snapcode is leaked and the user is receiving unwanted friend requests. Using this tool, I generated five Snapcodes for each of the accounts and combined these into a single string using the following rules: each character of this string was assigned a value of “1” if each of the five Snapcodes had a dot in the corresponding position, “0” if none of them had a dot in that position, or “x” if some had a dot and some didn’t. 

Reducing the noise in the data with this new representation made the answer I had been looking for as clear as day. The modified bit-strings looked like this:   

xx0xxxxxxxxxxxxxxxxxxx1xxxxxxxxx010xxxxx0101000100010100010001010101000100010100010001010101000100010100010001010010000100101100 

xxxxxxxxxx0xxxxxxxxxxxx0xxxxxxxx011xxxxx0001110011000111011100010001110011000111011100010001110011000111011100010010010001000010

These three extra bits (underlined) were separated from the rest of the data I had been looking at, bringing the total to 91. This meant the process of encoding a username could be done one character at a time. I felt quite silly having spent so much time trying to fit the username into fewer bits rather than looking for more bits that may be used, but I imagine the path of a treasure hunt is seldom a straight one.

Digging for Gold

Because the values of these 91 bits were identical in each of the five Snapcodes, it seemed safe to assume that they somehow contained the username. I continued from here using the Snapcodes of two more users: “abcdefghmnopggg” and “bcdefghnopqhhh”. The first seven characters are sequential and offset by one between the two names, a pattern I was hoping would highlight which bits were being incremented for each character. The respective bit-strings were:

...010xxxxx0101100110011000110001100111100110100000110010001011101010110000000011001000001000100000 

...011xxxxx01100001000110101110011110000001101000100000101111001011101101000010100010001010011x0xx0

Once again, some interesting patterns showed up. Both strings could be split up into segments whose binary values were either the same between the two usernames or off by exactly one:

010 ... 01011 001 1 001100 0 110 00110 01111 001 1 010000 ...
011 ... 01100 001 0 001101 0 111 00111 10000 001 1 010001 ...

Presumably, the segments that were identical between the two strings were the higher bits of the encoded character, whose values we may not expect to change, and the off-by-one segments were the lower bits, whose values would be incremented when representing sequential characters. 

I also noticed that the lengths of these segments followed the sequence 5-3-1-6-1-3-5. A strange pattern, it seemed at first, but it eventually dawned on me that these segments could be paired up to create chunks of six bits, each of which could represent a single character. I began enumerating the possible combinations of these segments, eventually coming across the following set of six-bit chunks:

[001|010] [0|01011] [001100] [00110|1] [001|110] [0|01111] [010000] ...
[001|011] [0|01100] [001101] [00111|0] [001|111] [0|10000] [010001] ...

Converted to decimal, these values show the same characteristics seen in the pair of usernames:

10, 11, 12, 13, 14, 15, 16 ...
11, 12, 13, 14, 15, 16, 17 ...

The second unknown, how these values were being converted into characters, fell quite nicely into place from here. Assuming 10 mapped to ‘a’, 11 to ‘b’, and so on, it felt safe to assume that 0 through 9 mapped to ‘0’ through ‘9’, and 36 through 38 represented the three symbols. Verifying these assumptions and identifying the exact value assigned to each character was achieved by testing them on a range of other usernames.

One final detail fell into place when trying to decode usernames that did not use all 15 available characters. The end of a username was simply marked by any value greater than 38, after which the remaining bits were ignored by the decoding process. QR codes use a similar mechanism, designed to avoid large empty spaces in the barcode that make it unsightly and harder to scan. 

In Python, the process of reordering the bit-string into six-bit chunks took the form of lists of integers whose value indicated the position of a bit in the bit-string. For example, the binary value of the first character was determined by taking bits 46-48 of the bit-string and appending bits 33-35:

USERNAME_DATA = [
    [46, 47, 48, 33, 34, 35],
    [56, 41, 42, 43, 44, 45],
    [50, 51, 52, 53, 54, 55],
    [60, 61, 62, 63, 64, 49],
    [70, 71, 72, 57, 58, 59],
    [80, 65, 66, 67, 68, 69],
    [74, 75, 76, 77, 78, 79],
    [84, 85, 86, 87, 88, 73],
    [94, 95, 96, 81, 82, 83],
    [104, 89, 90, 91, 92, 93],
    [98, 99, 100, 101, 102, 103],
    [108, 109, 110, 111, 112, 97],
    [118, 119, 120, 105, 106, 107],
    [128, 113, 114, 115, 116, 117],
    [122, 123, 124, 125, 126, 127]
]

A dictionary converted the decimal values of these chunks to characters:

HAR_MAP = {
    0: '0', 1: '1', 2: '2', ..., 9: '9',
    10: 'a', 11: 'b', 12: 'c', ..., 35: 'z',
    36: '-', 37: '_', 38: '.'  
}

With that, I was at last able to trace the username data through each stage of the decoding process: dots, bits, six-bit chunks, and finally characters.

Chapter 5: A Smooth Sail Home

Tying up Loose Ends

Revisiting my third research question, What actions can be triggered when these codes are scanned?, was simple compared to what I had just been through. Snapchat publicly documented several other types of Snapcodes that were easy to interact with, like URL Snapcodes and content Snapcodes to unlock in-app content. Others I had to read about, like ones that are used to pair Snapchat’s “Spectacles” devices to your phone [12]. 

I found the above Snapcode on a mysterious page of Snapchat’s website, which contained only the title “Snapchat Update.” Scanning it in the app did nothing on my phone, but presumably it would update the Snapchat app if it was out of date. I spent a good deal of time trying to reverse engineer the app to determine how this Snapcode is handled, and whether there were any other undocumented functions a Snapcode may invoke, but I was unable to find anything.

One final loose end that a curious reader may have identified was the mechanism for deactivating old Snapcodes mentioned in the previous chapter. Having several Snapcodes for each of the test users, I compared the values of the non-username bits both across accounts (e.g. the first Snapcode for each account) and within accounts (i.e. the sequence of Snapcodes for a single account). No discernible patterns showed up, which led me to hypothesize that the Snapcodes were differentiated by some sort of random key in the non-username bits. In this scenario, each account would be associated with one “active” key at a time, and the Snapchat app would only perform the add-friend function if the Snapcode with that user’s active key was scanned.

A Last Golden Nugget

I decided to see what else I could find in those types of Snapcode I could easily create, but neither one showed any patterns between the underlying data and the resulting Snapcode. As seen earlier, URL Snapcodes change drastically even when creating two that redirect to the same URL, and the content Snapcodes show no correlation between the barcode and the content pack metadata like the author, name, etc. 

Exploring Snapchat’s website eventually led me to the following URL:

https://www.snapchat.com/unlock/?type=SNAPCODE&uuid=c4bf0e0ec8384a06b22f67edcc02d1c3

On this page, there is a Snapcode labeled “Gold Fish Lens” that presumably once unlocked a Snapchat lens, though this no longer works when scanning it in the app. However, the HTTP parameter “uuid=c4bf0e0ec8384a06b22f67edcc02d1c3” jumped out as a possible piece of data that was being stored in this type of Snapcode. Sure enough, converting the dots to a bit-string (just as we did with the username) and then converting this bit-string to a hexadecimal string resulted in this exact UUID!

I found a similar piece of data when creating a URL Snapcode. The initial response includes a “scannableId” in a similar format to the UUID. This value is then used in a subsequent request to pull up the image of the resulting Snapcode, leading me to believe it serves the same general purpose. 

Based on these findings, I hypothesized the following work flow: Whenever a new lens filter or sticker pack is created or a new URL Snapcode is requested, a UUID is generated and stored in a database along with any associated information like the content pack name or URL. When a Snapcode of one of these types is scanned in the app, it prompts a web request including this UUID to query the database and determine what action to perform.

There was nothing more I could (legally) try to definitively confirm this hypothesis, so I guess I’ll just have to wait for Snapchat to tell me if I got it right.

Final Considerations

Reflecting on this exercise, I came up with a few personal takeaways, as well as some thoughts for organizations who have their own proprietary barcode system or perhaps are considering implementing one. 

The first implication for barcode systems is that if they are used to store recognizable data, they can feasibly be cracked. Had I not known what data was stored in the add-friend Snapcodes, this entire project would have been dead in the water. It may be impossible to keep the process of barcode-to-bit-string transformation entirely secret if you need that functionality in client-accessible software (like the Snapchat mobile app), but this alone will not be enough to crack the barcode system if you don’t know the underlying data.

This makes Snapchat’s UUID system a great way to avoid leaking potentially sensitive information and significantly decrease the risk of the barcodes being reverse engineered in the first place. If the bits are translated directly to a hexadecimal UUID then perhaps there’s a chance of guessing how to decode the UUID as I did, but without access to the database that value is meaningless.

Inversely, storing any sensitive information in a barcode is a very bad idea, for obvious reasons. Even Snapchat’s inclusion of username data is potentially dangerous. Recall the solution they came up with in case an old Snapcode is leaked and the user is receiving unwanted friend requests; a malicious user can extract the username and find the updated Snapcode at this URL: https://www.snapchat.com/add/USERNAME. Snapchat does have other controls to prevent unwanted friend requests, but the ability to find a user’s active Snapcode effectively nullifies the current mitigation. (I did disclose this to Snapchat, and they have acknowledged and accepted the issue.)

As for my personal takeaways, the first is that sometimes it pays to have a wide range of skills, even if your experience is minimal. The skills involved in this challenge included reverse engineering, scripting, Android internals and development, web development, and logic. I am far from an expert in any of these domains, but in a challenge where the solution is not just a matter of one’s depth of technical knowledge, any angle of attack you can find is important. This could be as simple as knowing that a tool exists to do something you need.

Finally, I’d like to think I learned a lesson about making assumptions. When the information surrounding a problem is incomplete, some assumptions are required to make any progress at all, but it’s important to revisit these every so often to make sure they aren’t sending you down a rabbit hole. A breadth-first approach, exploring several possible solutions together as opposed to one at a time in depth, may have lessened the pain of realizing that days of work were useless.

I am sure you learned more than you ever wanted to know about Snapcodes, but I thank you for joining me for this adventure!

INSIGHTS, RESEARCH | July 30, 2021

Breaking Protocol (Buffers): Reverse Engineering gRPC Binaries

The Basics

gRPC is an open-source RPC framework from Google which leverages automatic code generation to allow easy integration to a number of languages. Architecturally, it follows the standard seen in many other RPC frameworks: services are defined which determine the available RPCs. It uses HTTP version 2 as its transport, and supports plain HTTP as well as HTTPS for secure communication. Services and messages, which act as the structures passed to and returned by defined RPCs, are defined as protocol buffers. Protocol buffers are a common serialization solution, also designed by Google.

Protocol Buffers

Serialization using protobufs is accomplished by definining services and messages in .proto files, which are then used by the protoc protocol buffer compiler to generate boilerplate code in whatever language you’re working in. An example .proto file might look like the following:

// Declares which syntax version is to follow; read by protoc
syntax = "proto3";

// package name allows for namespacing to avoid conflicts
// between message types. Will also determine namespace in C++
package stringmanipulation;


// The Service definition: this specifies what RPCs are offered
// by the service
service StringManipulation {

    // First RPC. RPC definitions are like function prototypes:
    // RPC name, argument types, and return type is specified.
    rpc reverseString (StringRequest) returns (StringReply) {}

    // Second RPC. There can be arbitrarily many defined for
    // a service.
    rpc uppercaseString (StringRequest) returns (StringReply) {}
}

// Example of a message definition, containing only scalar values.
// Each message field has a defined type, a name, and a field number.
message innerMessage {
    int32 some_val = 1;
    string some_string = 2;
}

// It is also possible to specify an enum type. This can
// be used as a member of other messages.
enum testEnumeration {
    ZERO = 0;
    ONE = 1;
    TWO = 2;
    THREE = 3;
    FOUR = 4;
    FIVE = 5;
}

// messages can contain other messages as field types.
message complexMessage {
    innerMessage some_message = 1;
    testEnumeration innerEnum = 2;
}

// This message is the type used as the input to both defined RPCs.
// Messages can be arbitrarily nested, and contain arbitrarily complex types.
message StringRequest {
    complexMessage cm = 1;
    string original = 2;
    int64 timestamp = 3;
    int32 testval = 4;
    int32 testval2 = 5;
    int32 testval3 = 6;
}

// This message is the type for the return value of both defined RPCs.
message StringReply {
    string result = 4;
    int64 timestamp = 2;
    complexMessage cm = 3;
}

There is a lot more to protocol buffers and the available options, if you’re interested Google has a very good language guide.

gRPC

gRPC is an RPC implementation designed to use protobufs to take care of all boilerplating necessary for implementation, as well as provided functions to manage the connection between the RPC server and its clients. The majority of compiled code in a gRPC server binary will likely be either gRPC library code and autogenerated classes, stubs etc. created with protoc. Only the actual implementation of RPCs is required of the developer and accomplished by extending the base Service class generated by protoc based on the definitions in .proto files..

Transport

gRPC uses HTTP2 for transport, which can either be on top of a TLS connection, or in the clear. gRPC also supports mTLS out of the box. What type of channel is used is configured by the developer while setting up the server/client.

Authentication

As mentioned above, gRPC support mTLS, wherein both the server and the client are identified based on exchanged TLS certificates. This appears to be the most common authentication mechanism seen in the wild (though “no authentication” is also popular). gRPC also supports Google’s weird ALTS which I’ve never seen actually being used, as well as token-based authentication.

It is also possible that the built-in authentication mechanisms will be eschewed for a custom authentication mechanism. Such a custom implementation is of particular interest from a security perspective, as the need for a custom mechanism suggests a more complex (and thus more error prone) authentication requirement.

gRPC Server Implementation

The following will be an overview of the major parts of a gRPC server implementation in C++. A compiled gRPC server binary can be extremely difficult to follow, thanks to the extensive automatically generated code and heavy use of gRPC library functions. Understanding the rough structure that any such server will follow (important function calls and their arguments) will greatly improve your ability to make sense of things and identify relevant sections of code which may present an attack surface.

Server Setup

The following is the setup boilerplate for a simple gRPC server. While a real implementation will likely be more complex, the function calls seen here will be the ones to look for in unraveling the code.

void RunServer() {
    std::string listen = "127.0.0.1:50006";
    // This is the class defined to implement RPCs, will be covered later
    StringManipulationImpl service;

    ServerBuilder builder;

    builder.AddListeningPort(listen, grpc::InsecureServerCredentials());
    builder.RegisterService(&service);

    std::unique_ptr<grpc::Server> server(builder.BuildAndStart());
    std::cout << "Server listening on port: " << listen << "\n";
    server->Wait();
}
  • builder.AddListeningPort: This function sets up the listening socket as well as handling the transport setup for the channel.
    • arg1: addr_uri: a string composed of the IP address and port to listen on, separated by a colon. i.e. “127.0.0.1:50001”
    • arg2: creds: The credentials associated with the server. The function call used here to generate credentials will indicate what kind of transport is being used, as follows:
      • InsecureServerCredentials: No encryption; plain HTTP2
      • SslServerCredentials: TLS is in use, meaning the client can verify the server and communication will be encrypted. If client authentication (mTLS) is to be used, relevant options will be passed to this function call. For example, setting opts.client_certificate_request to GRPC_SSL_REQUEST_AND_REQUIRE_CLIENT_CERTIFICATE_AND_VERIFY will require the client supply a valid certificate. Any potential vulnerabilities at this point will be in the options passed to the SslServerCredentials constructor, and will be familiar to any consultant. Do they verify the client certificate? Are self-signed certificates allowed? etc., standard TLS issues.
  • builder.RegisterService: This crucial function is what determines what services (and thereby what RPC calls) are available to a connecting client. This function is called as many times as there are services. The argument to the function is an instance of the class which actually implements the logic for each of the RPCs — custom code. This is the main point of interest for any gRPC server code review or static analysis, as it will contain the clients own implementation, where the likelihood of mistakes and errors will be higher.

RPC Implementation

The following is the implementation of the StringManipulationImpl instance passed to RegisterService above.

class StringManipulationImpl : public stringmanipulation::StringManipulation::Service {
    Status reverseString(ServerContext *context, 
                         const StringRequest *request, 
                         StringReply *reply) {


        std::string original = request->original();
        std::string working_copy = original;
        std::reverse(working_copy.begin(), working_copy.end());
        reply->set_result(working_copy);

        struct timeval tv;
        gettimeofday(&tv, NULL);

        printf("[%ld|%s] reverseString(\"%s\") -> \"%s\"\n", 
                tv.tv_sec, 
                context->peer().c_str(), 
                request->original().c_str(), 
                working_copy.c_str());

        return Status::OK;
    }

    Status uppercaseString(ServerContext *context, 
                           const StringRequest *request, 
                           StringReply *reply) {

        std::string working_copy = request->original();
        for (auto &c: working_copy) c = toupper(c);
        reply->set_result(working_copy.c_str());

        struct timeval tv;
        gettimeofday(&tv, NULL);

        printf("[%ld|%s] uppercaseString(\"%s\") -> \"%s\"\n", 
                tv.tv_sec, 
                context->peer().c_str(), 
                request->original().c_str(), 
                working_copy.c_str());

        return Status::OK;

    }
};

Here we see the implementation for each of the two defined RPCs for the StringManipulation service. This is accomplished by extending the base service class generated by protoc. gRPC implementation code like this will often follow this naming scheme, or something like it — the service name, appended by “Impl,” “Implementation,” etc.

Static Analysis

Finding Interesting Logic

These functions, generally, are among the most interesting targets in any test of a gRPC service. The bulk of the logic baked into a gRPC binary will be library code, and these functions which will actually be parsing and handling the data transmitted via the gRPC link. These functions can be located/categorized by looking for calls to builder.RegisterService.

Here we see just one call, because the example is simple, but in a more complex implementation there may be many calls to this function. Each one represents a particular service being made available, and will allow for the tracking down of the implementations of each RPC for those services. Navigating to the cross reference address, we see that an object is being passed to this function. Keep in mind this binary has been pre-annotated for clarity and the initial output of the reverse engineering tool will likely be less clear. However the function calls we care about should be clear enough to follow without much effort.

We see that before being passed to RegisterService, the stringManipulationImplInstance (name added by me) is being passed to a function, StringManipulationImpl::StringManipulationImpl. Based both on the context and the demangled name, this is a constructor for whatever class this is. We can see the constructor itself is very simple: 

The function calls another constructor (the base class constructor) on the passed object, then sets the value at object offset 0. In C++, this offset is usually (and in this case) reserved for the class’s vtable. Navigating to that address, we can see it:

Because this binary is not stripped, the actual names of the functions (matching the RPCs) are displayed. With a stripped binary, this is not the case, however an important quirk of the gRPC implementation results in the vtables for service implementations always being structured in a particular way, as follows.

  • The first two entries in the vtable are constructor/destructors.
  • Each subsequent entry is one of the custom RPC implementations, in the order that they appear in the .proto file. This means that if you are in possession of the .proto file for a particular service, even if a binary is stripped, you can quickly identify which implementation corresponds to which RPC. And if you don’t have the .proto file, but do have the binary, there is tooling available which is very effective at recovering .proto files from gRPC binaries, which will be covered later. This is helpful not only because you may get a hint at what the RPC does based on its name, but also because you will know the exact types of each of the arguments.

Anatomy of an RPC

There are a few details which will be common to all RPC implementations which will aid greatly in reverse engineering these functions. The first are the arguments to the functions:

  • Argument 1: Return value, usually of type grpc::Status. This is a C++ ABI thing, see section 3.1.3.1 of the Itanium C++ ABI Spec. Tracking sections of the code which write to this argument may be helpful in understanding authorization logic which may be baked into the function, for example if a function is called, and depending on its return value, arg1 is set to either grpc::Status::OK or grpc::Status::CANCELLED, that function may have something to do with access controls.
  • Argument 2: The this pointer. Points to the instance of whatever service class the RPC is a method on.
  • Argument 3: ServerContext. From the gRPC documentation:
    A ServerContext or CallbackServerContext allows the code implementing a service handler to:

    • Add custom initial and trailing metadata key-value pairs that will propagated to the client side.
    • Control call settings such as compression and authentication.
    • Access metadata coming from the client.Get performance metrics (ie, census).

    We can see in this function that the context is being accessed in a call to ServerContextBase::peer, which retrieves metadata containing the client’s IP and port. For the purposes of reverse engineering, that means that accesses of this argument (or method calls on it) can be used to access metadata and/or authentication information associated with the client calling the RPC. So, it may be of interest regarding authentication/authorization auditing. Additionally, if metadata is being parsed, look for data parsing/memory corruption etc. issues there.
  • Argument 4: RPC call argument object. This object will be of the input type specified by the .proto file for a given RPC. So in this example, this argument would be of type stringmanipulation::StringRequest. Generally, this is the data that the RPC will be parsing and manipulating, so any logic associated with handling this data is important to review for data parsing issues or similar that may lead to vulnerabilities.
  • Argument 5: RPC call return object. This object will be of the return type specified by the .proto file for a given RPC. So in this example, this argument would be of type stringmanipulation::StringReply. This is the object which is manipulated prior to return to the client.

Note: In addition to unary RPCs (a single request object and single response object), gRPC also supports streaming RPCs. In the case of unidirectional streams, i.e. where only one of the request or response is a stream, the number of arguments and order is the same, and only the type of one of the arguments will differ. For client-side streaming (i.e. the request is streamed) Argument 4 will be wrapped with a ServerReader, so in this example it will be of type ServerReader<StringRequest>. For Server side streaming (streamed response), it will be wrapped with a ServerWriter, so ServerWriter<StringReply>.

For bidirectional streams, where both the request and the response are streamed, the number of arguments differ. Rather than a separate argument for request and response, the function only has four arguments, with the forth being a ServerReaderWriter wrapping both types. In this example, ServerReaderWriter<StringRequest, StringReply>. See the gRPC documentation for more information on these wrappers. The C++ Basics Tutorial has some good examples.

Protobuf Member Accesses in C++

The classes generated by protoc for each of the input/output types defined in the .proto file are fairly simple. Scalar typed members are stored by value as member variables inside the class instance. Non-scalar values are stored as pointers to the member. The class includes (among other things) the following functions for getting and setting members:

  • .<member>(): get the value of the field with name <member>. This is applicable to all types, and will return the value itself for scalar types and a pointer to the member for complex/allocated types.
  • .set_<member>(value_to_set): set the value for a type which does not require allocation. This includes scalar fields and enums.
  • .set_allocated_<member>(value_to_set): set the value for a complex type, which requires allocation and setting of its own member values prior to setting in the request or reply. This is for composite/nested types.

The actual implementation for these functions is fairly uncomplicated, even for allocated types, and basically boils down to accessing the value of a pointer at some offset into the object whose member is being retrieved or set. These functions will not be named in a stripped binary, but are easy to spot.

The getters take the request message (in this example, request) as the sole argument, pass it through a couple of nested function calls, and eventually make an access to some offset into the message. Based on the offset, you can determine which field is being accessed, (with the help of the generated pb.h files, generation of which is covered later) and can thus identify the function and its return value.

The implementation for complex types is similar, adding a small amount of extra code to account for allocation issues.

Setter functions follow an almost identical structure, with the only difference being that they take the response message (in this example, reply) as the first argument and the value to set the field to as the second argument. 

And again, the only difference for complex type setters is a bit of extra logic to handle allocation when necessary.

Reconstructing Types

The huge amount of automatically generated code used by gRPC is a great annoyance to a prospective reverse engineer, but it can also be a great ally. Because the manner in which the .proto files are integrated into the final binary is uniform, and because the binary must include this information in some form to correctly deserialize incoming messages, it is possible in most cases to extract a complete reconstruction of the original .proto file from any software which uses gRPC for communication, whether that be a client or server.

This can be done manually with some studying up on protobuf Filedescriptors, but more than likely this will not be necessary — someone has probably already written something to do it for you. For this guide the Protobuf Toolkit (pbtk) will be used, but a more extensive list of available software for extracting .proto structures from gRPC clients and servers will be included in the Tooling section.

Generating .proto Files

By feeding the server binary we are working with into pbtk, the following .proto file is generated.

syntax = "proto3";

package stringmanipulation;

service StringManipulation {
    rpc reverseString(StringRequest) returns (StringReply);
    rpc uppercaseString(StringRequest) returns (StringReply);
}

message innerMessage {
    int32 some_val = 1;
    string some_string = 2;
}

message complexMessage {
    innerMessage some_message = 1;
    testEnumeration innerEnum = 2;
}

message StringRequest {
    complexMessage cm = 1;
    string original = 2;
    int64 timestamp = 3;
    bool testval = 4;
    bool testval2 = 5;
    bool testval3 = 6;
}

message StringReply {
    string result = 4;
    int64 timestamp = 2;
    complexMessage cm = 3;
}

enum testEnumeration {
    ZERO = 0;
    ONE = 1;
    TWO = 2;
    THREE = 3;
    FOUR = 4;
    FIVE = 5;
}

Referring back to the original .proto example at the beginning, we can see this is a perfect match, even preserving order of RPC declarations and message fields. This is important because we can now begin to correlate vtable members with RPCs by name and argument types. However, while we know the types of arguments being passed to each RPC, we do not know how each field is ordered inside the c++ object for each type. Annoyingly, the order of member variables for the generated class for a given type appears to be correlated neither to the order of definition in the .proto file, nor to the field numbers specified.

However, auto-generated code comes to the rescue again. While the order of member variables doe not appear to be tied to the .proto file at all, it does appear to be deterministic, based on analysis of numerous gRPC binaries. protoc uses some consistent metric for ordering the fields when generating the .pb.h header files, which are the source of truth for class/structure layout for the final binary. And conveniently, now that we have possession of a .proto file, we can generate these headers.

Defining Message Structures

The command protoc --cpp_out=. <your_generated_proto_file>.proto will compile the .proto file into the corresponding pb.cc and pb.h files. Here we’re interested in the headers. There is quite a bit of cruft to sift through in these files, but the general structure is easy to follow. Each type defined in the .proto file gets defined as a class, which includes all methods and member variables. The member variables are what we are interested in, since we need to know their order and C++ type in order to map out structures for each of them while reverse engineering.

The member variable declarations can be found at the very bottom of the class declaration, under a comment which reads @@protoc_insertion_point(class_scope:<package>.<type name>)

// @@protoc_insertion_point(class_scope:stringmanipulation.StringRequest)
 private:
  class _Internal;

  template <typename T> friend class ::PROTOBUF_NAMESPACE_ID::Arena::InternalHelper;
  typedef void InternalArenaConstructable_;
  typedef void DestructorSkippable_;
  ::PROTOBUF_NAMESPACE_ID::internal::ArenaStringPtr original_;
  ::stringmanipulation::complexMessage* cm_;
  ::PROTOBUF_NAMESPACE_ID::int64 timestamp_;
  bool testval_;
  bool testval2_;
  bool testval3_;
  mutable ::PROTOBUF_NAMESPACE_ID::internal::CachedSize _cached_size_;
  friend struct ::TableStruct_stringmanipulation_2eproto;

The member fields defined in the .proto file will always start at offset sizeof(size_t) * 2 bytes from the class object, so 8 bytes for 32 bit, and 16 bytes for 64 bit. Thus, for the above class (StringRequest), we can define the following struct for static analysis:

// assuming 64bit architecture, if 32bit pointer sizes will differ
struct StringRequest __packed {
    0x00: uint8_t dontcare[0x10];
    0x10: void *original_string; 
    0x18: struct complexMessage *cm; // This will also need to be defined, 
                                     // the same technique inspecting the pb.h file applies
    0x20: int64_t timestamp;
    0x28: uint8_t testval;
    0x29: uint8_t testval2;
    0x2a: uint8_t testval3;
};

Note: protobuf classes are packed, meaning there is no padding added between members to ensure 4 or 8 byte alignment. For example, in the above structure, the three bools will be found one after another at offsets 0x28, 0x29, and 0x2a, rather than at 0x28, 0x2c, and 0x30 as would be the case with 4 bit aligned padding. Ensure that your reverse engineering tool knows this when defining structs.

Once structures have been correctly defined for each of the types, it becomes quite easy to determine what each function and variable is. Take the first example for the Protobuf Member Accesses section, now updated to accept an argument of type StringRequest:

Its clear now that this function is the getter for the StringRequest.original, a string. Applying this technique to the rest of the RPC, changing function and variable names as necessary, produces fairly easy to follow decomplication:

From here, it is as simple as standard static analysis to look for any vulnerabilities which might be exploited in the server, whether it be in incoming data parsing or something else.

Active Testing

Most of the active testing/dynamic analysis to be performed re: gRPC is fairly self explanatory, and is essentially just fuzzing/communicating over a network protocol. If the .proto files are available (or the server or client binary is available, and thus the .proto files can be generated), they can be provided to a number of existing gRPC tooling to communicate with the server. If no server, client, or .protos are available, it is still possible to reconstruct the .proto to some extend via captured gRPC messages. Resources for various techniques and tools for actively testing a gRPC connection can be found in the Tooling section below.

Tooling

  • Protofuzz – ProtoFuzz is a generic fuzzer for Google’s Protocol Buffers format. Takes a proto specification and outputs mutations based on that specification. Does not actually connect to the gRPC server, just produces the data.
  • Protobuf Toolkit – From the pbtk README:

pbtk (Protobuf toolkit) is a full-fledged set of scripts, accessible through an unified GUI, that provides two main features:

  1. Extracting Protobuf structures from programs, converting them back into readable .protos, supporting various implementations:
    • All the main Java runtimes (base, Lite, Nano, Micro, J2ME), with full Proguard support,
    • Binaries containing embedded reflection metadata (typically C++, sometimes Java and most other bindings),
    • Web applications using the JsProtoUrl runtime.
  2. Editing, replaying and fuzzing data sent to Protobuf network endpoints, through a handy graphical interface that allows you to edit live the fields for a Protobuf message and view the result.
  • grpc-tools/grpc-dump – grpc-dump is a grpc proxy capable of deducing protobuf structure if no .protos are provided. Can be used similarly to mitmdump. grpc-tools includes other useful tools, including the grpc-proxy go library which can be used to write a custom proxy if grpc-dump does not suit the needs of a given test.
  • Online Protobuf Decoder – Will pull apart arbitrary protobuf data (without requiring a schema), displaying the hierarchical content.
  • Awesome gRPC – A curated list of useful resources for gRPC.

Resources

INSIGHTS, RESEARCH | April 6, 2021

Watch Your Step: Research Into the Concrete Effects of Fault Injection on Processor State via Single-Step Debugging

Fault injection, also known as glitching, is a technique where some form of interference or invalid state is intentionally introduced into a system in order to alter the behavior of that system. In the context of embedded hardware and electronics generally, there are a number of forms this interference might take. Common methods for fault injection in electronics include:

  • Clock glitching (errant clock edges are forced onto the input clock line of an IC)
  • Voltage fault injection (applying voltages higher or lower than the expected voltage to IC power lines)
  • Electromagnetic glitching (Introducing EM interference)

This article will focus on voltage fault injection, specifically, the introduction of momentary voltages outside of normal operating conditions on the target device’s power rails. These momentary pulses or drops in input voltage (glitches) can affect device operation, and are directed with the intention of achieving a particular effect. Commonly desired effects include “corrupting” instructions or memory in the processor and skipping instructions. Previous research has shown that these effects can be predictably achieved [1], as well has provided some explanation as to the EM effects (caused by the glitch) which might be responsible for the various behaviors [2].

However, a gap in published research exists in correlating glitches (and associated EM effects) with concrete changes in state at the processor level (i.e. what exactly occurs in the processor at the moment of a glitch that causes an instruction to be corrupted or skipped, an incorrect branch to be taken, etc.). This article seeks to quantify and qualify the state of a processor before, during, and after an injected fault, and describe discrete changes in markers such as registers including general registers as well as control registers such as $pc and $lr, memory, and others.

Past Research and Thanks

Special thanks to the folks at Toothless Consulting, whose excellent series of blog posts [3] were my introduction to fault injection, and the inspiration for this project. Additional thanks to Chris Gerlinsky, whose research into embedded device security and in particular his talk [4] on breaking CRP on the LPC family of chips was an invaluable resource during this project.

Test Setup

The target device chosen for testing was the NXP LPC1343, an ARM Cortex-M3 microcontroller. In order to control the input target voltage and coordinate glitches, the Digilent Arty A7 development board was used, built around the Xilinx Artix 7 FPGA. Custom gateware was developed for the Arty board, in order to facilitate control and triggering of glitches based on a variety of factors. For the purposes of this article, the two main triggers used are a GPIO line which goes high/low synchronized to certain device operations, and SWD signals corresponding to a “step” event. The source code for the FPGA gateware is available here.

In order to switch between the standard voltage level (Vdd) and the glitch voltage level (Vglitch), a Maxim MAX4617 Multiplexer IC was used. It is capable of switching between inputs in as little as 10ns, and is thus suitable for producing a glitch waveform on the LPC 1343 power rails with sufficient accuracy and timing. 

As illustrated in the image above, the Arty A7 monitors a “trigger” line, either a GPIO output from the target or the SWD lines between the target and the debugger, depending on the mode of operation. When the expected condition is met, the A7 will drive the “glitch out” according to a provided waveform specifier, triggering a switch between Vdd and Vglitch via the Power Mux Circuit and feeding that to the target Vcore voltage line. A Segger J-Link was used to provide debug access to the target, and the SWD lines are also fed to the A7 for triggering.

In order to facilitate triggering on arbitrary SWD commands, a barebones SWD receiver was implemented on the A7. The receiver parses SWD transactions sniffed from the bus, and outputs the deserialized header and transaction data, values which can then be compared with a pre-configured target value. This allows for triggering of the glitchOut line based on any SWD data – for example, the S TEP and RESUME transactions, providing a means of timing glitches for single-stepped instructions.

Prior to any direct testing of glitches performed while single-stepping instructions, observing glitches during normal operation and the effects they cause is helpful to provide a base understanding, as well as to provide a platform for making assumptions which can be tested later on. To provide an environment for observing the results of glitches of varied form and duration, program execution consists of a simple loop, incrementing and decrementing two variables. At each iteration, the value of each variable is checked against a known target value, and execution will break out of the loop when either one of the conditions is met. Outside of the loop, the values are checked against expected values and those values are transmitted via UART to the attacking PC if they differ.

Binary Ninja reverse engineering software was used to provide a visual representation of the compiled C. Because the assembly presented represents the machine code produced after compiling and linking, we can be sure that it matches the behavior of the processor exactly (ignoring concepts like parallel execution, pipelining etc. for now), and lean on that information when making assumptions about timing and processor behavior with regard to injecting faults.

Though simple, this environment provides a number of interesting targets for fault injection. Contained in the loop are memory access instructions (LDR, STR), arithmetic operations (ADDS, SUBS), comparisons, and branching operations. Additionally, the pulse of PIO2_6 provides a trigger for the glitchOut signal from the FPGA – depending on the delay applied to that signal, different areas/instructions in the overall loop may be targeted. By tracing the power consumption of the ARM core with a shunt resistor and transmission line probe, execution can be visualized. 

The following waveform shows the GPIO trigger line (blue), and the power trace coming from the LPC (purple). The GPIO line goes high for one cycle then low, signaling the start of the loop. What follows is a pattern which repeats 16 times, representing the 16 iterations of the loop. This is bounded on either side by the power trace corresponding to the code responsible for writing data to the UART, and branching back to the start of the main loop, which is fairly uniform. 

We now have: 

  1. A reference of the actual instructions being executed by the processor (the disassembly via Binary Ninja)
  2. A visual representation of that execution, viewable in real time as the processor executes (via the power trace)
  3. A means of taking action within the system under test which can be calibrated based on the behavior of the processor (the FPGA glitcher).

Using the above information, it is possible to vary the offset of the glitch from the trigger, and (roughly) correlate that timing to a given instruction or group of instructions being executed. For example, by triggering a glitch sometime during the sixth repetition of the pattern on the power trace, we can observe that that portion of the power trace appears to be cut off early, and the values reported over UART by the target reflect some kind of misbehavior or corruption during the sixth iteration of the loop.

So far, the methodology employed has been in line with traditional fault injection parameter search techniques – optimize for visibility into a system to determine the most effective timing and glitch duration using some behavior baked into device operation (here, a GPIO line pulsing). While this provides coarse insight into the effects of a successfully injected fault (for the above example we can make the assumption that an operation at some point during the sixth iteration of the loop was altered, any more specificity is just speculation), it may have been a skipped load instruction, a corrupted store, or a flipped compare among many other possibilities.

To illustrate this point, the following is the parsed, sorted, and counted output of the UART traffic from the target device, after running the glitch for a few thousand iterations of the outer loop. The glitch delay and duration remained constant, but resulted in a fairly wide spread of discreet effects on the state of the variables at the end of the loop. Some entries are easy to reason about, such as the first and most common result: B is the expected value after six iterations (16 – 6 = 10), but A is 16, and thus a skipped LDR or STR instruction may have left the value 16 in the register placed there by previous operations. However, other results are harder to reason about, such as the entries containing ascii text, or entries where the variable with the incorrect value doesn’t appear to correlate to the iteration number of the loop.

This level of vagueness is acceptable in some applications of fault injection, such as breaking out of an infinite loop as is sometimes seen in secure boot bypass techniques. However, for more complex attacks where a particular operation needs to be corrupted in just the right way greater specificity, and thus a more granular understanding, is a necessity. 

And so what follows is the novel portion of the research conducted for this article: creating a methodology for targeting fault injection attacks to single instructions, leveraging debug interfaces such as SWD/JTAG for instruction isolation and timing. In addition to the research value offered by this work, the developed methodology may also have practical applications under certain, not uncommon circumstances regarding devices in the wild as well, which will be discussed in a later section. 

A (Very) Quick Rundown of the SWD protocol

SWD is a debugging protocol developed by ARM and used for debugging many devices, including the Cortex-M3 core in the LPC 1343 target board. From the ARM Debug Interface Architecture Specification ADIv5.0 to ADIv5.2

The Arm SWD interface uses a single bidirectional data connection and a separate clock to transfer data synchronously. An operation on the wire consists of two or three phases: packet request, acknowledgement response, and data transfer.

Of course, there’s more to it than that, but for the purposes of this article all we’re really interested in is the data transfer, thanks to a quirk of Cortex-M3 debugging registers: halting, stepping, and continuing execution are all managed by writes to the Debug Halting Control and Status Register (DHCSR). Additionally, writes to this register are always prefixed with 0xA05F, and only the low 4 bits are used to control the debug state — [MASKINTS, STEP, HALT, DEBUGEN] from high to low. So we can track STEP and RESUME actions by looking for SWD write transaction with the data 0xA05F0001 (RESUME) and 0xA05F000D (STEP).

Because of the aforementioned bidirectionality of the protocol, it isn’t as easy as just matching a bit pattern: based on whether a read or write transaction is taking place, and which phase is currently underway, data may be valid on either clock edge. Beyond that, there are also turnaround periods that may or may not be inserted between phases, depending on the transaction. The simplest solution turned out to be just implementing half of the protocol, and discarding the irrelevant portions keeping only the data for comparison. The following is a Vivado ILA trace of the-little-SWD-implementation-that-could successfully parsing the STEP transaction sniffed from the SWD lines.

Isolating Instructions

So, by single stepping an instruction and sniffing the SWD lines from the A7, it is possible to trigger a glitch the instant (or very close to, within 10ns) the data is latched by the target board’s debug machinery. Importantly, because the target requires a few trailing SWCLK cycles to complete whatever actions the debug probe requires of it, there is plenty of wiggle room between the data being latched and the actual execution of the instruction. And indeed, thanks to the power trace, there is a clear indication of the start of processor activity after the SWD transaction completes.

As can be seen above, there is a delay of somewhere in the neighborhood of 4us, an eternity at the 100MHz of the A7. By delaying the glitch to various offsets into the “bump” corresponding to instruction execution, we can finally do what we came here to do: glitch a single-stepping processor.

In order to produce a result more interesting than “look, it works!” a simple script was written to manage the behavior of the debugger/processor via OpenOCD. The script has two modes: a “fast” mode, which single steps as fast as the debugger can keep up with used for finding the correct timing and waveform for glitches, and a (painfully) “slow” mode, which inspects registers and the stack before and after each glitch event, highlighting any unexpected behavior for perusal. Almost immediately, we can see some interesting results glitching a load register instruction in the middle of the innermost loop — in this case a LDR r3, [sp] which loads the previous value of the A variable into r3, to be incremented in the next instruction.

We can see that nothing has changed, suggesting that the operations simply didn’t occur or finish — a skipped instruction. This reliably leads to an off-by-one discrepancy in the UART output from the device: either A/B ends up 1 less/greater than it should be at the end of the loop, because one of the inc/dec operations was acting on data which is not actually associated with the state of the A variable.

Interestingly, this research shows that the effectiveness of fault injection is not limited only to instructions which access memory (LDR, STR, etc.), but can also be used to affect the execution of arithmetic operations, such as ADDS and CMP, or even branch instructions (though whether the instructions themselves are being corrupted or if the corruption is occurring on the ASPR by which branches are decided requires further study). In fact, no instruction tested for this article proved impervious to single-step-glitching, though the rate of success did vary depending on the instruction.

We see here the CMP instruction which determines whether or not A matches the expected 0x10 being targeted. We see that the xPSR is not updated (meaning the zero flag is not set and as far as the processor is concerned, the CMP’d values did not match, and so the values of A and B are sent via UART. However, because it was the CMP instruction itself being glitched, the reported values are the correct 0x10 and 0. Interestingly, we see that r1 has been updated to 0x10, the same immediate value used in the original CMP. Referring to the ARMv7 Architecture Reference Manual, the machine code for CMP r3, 0x10 should be 0x102b. Considering possible explanations for the observed behavior, one might consider an instruction like LDR or MOVS, which could have moved the value into the r1 register. And as it turns out, the machine code for MOVS r1, 0x10 is 0x1021, not too many bits away from the original 0x102b!

While that isn’t the definitive answer as to cause for the observed behavior, its a guess well beyond the level of information available via power trace analysis and similar techniques alone. And if it is correct, we not only know what generally occurred to cause this behavior, but can even see which bits specifically in the instruction were flipped for a given glitch delay/duration.

Including all the script output for every instruction type in this article is a bit impractical, but for the curious the logs detailing registers/stack before and after each successful glitch for each instruction type will be made available in the git repo hosting the glitcher code. 

Practical Applications

I know what you’re thinking. 

“If you have access to a device via JTAG/SWD debugger, why fuss with all the fault injection stuff? You can make the device do anything you want! In fact, I recently read a great blog post where I learned how to take advantage of an open JTAG interface!”

However, there is a very common configuration for embedded devices in the wild to which the research presented here could prove useful. Many devices, including the STM32 series (such as the DUT for this article), implement a sort of “high but not the highest possible” security mode, which allows for limited debugging capabilities, but prevents reads and writes to certain areas of memory, rendering the bulk of techniques for leveraging an open JTAG connection ineffective. This is chosen over the more secure option of disabling debugging entirely because the latter leaves no option for fixing or updating device firmware (without a custom bootloader), and many OEMs may choose to err towards serviceability rather than security. In most such implementations though, single stepping is still permitted!

In such a scenario, aided by a copy of device firmware, a probing setup analogous the one described here, or both, it may be possible to render an otherwise time-consuming and tedious attack nearly trivial, stripping away all the calibration and timing parameterization normally required for fault injection attacks. Need to bypass secure boot on a partially locked down device? No problem, just break on the CMP that checks the return value of is_secureboot_enabled().

Future Research

Further research is required to really categorize the applicability of this methodology during live testing, but the initial results do seems promising. Further testing will likely be performed on more realistic/practical device firmware, such as the previously mentioned secure boot scenario.

Additionally and more immediately, part two of this series of blog posts will continue to focus on developing a better understanding of what happens within an integrated circuit, and in particular a complex IC such as a CPU, when subjected to fault injection attacks. I have been putting together an 8-bit CPU out of 74 series discreet components in my spare time over the last few months and once complete it will make the perfect target for this research: the clock is controllable/steppable externally, and each individual module (the bus, ALU, registers, etc.) are accessible by standard oscilloscope probes and other equipment. 

This should allow for incredibly close examination of system state under a variety of conditions, and make transitory issues caused by faults which are otherwise difficult to observe (for example an injected fault interfering with the input lines of the ALU but not the actual input registers) quite clear to see.

Stay tuned!

Video Demonstration

References

[1] J. Gratchoff, “Proving the wild jungle jump,” University of Amsterdam, Jul. 2015
[2] Y. Lu, “Injecting Software Vulnerabilities with Voltage Glitching,” Feb. 2019
[3] D. Nedospasov, “NXP LPC1343 Bootloader Bypass,” Aug. 2017, https://toothless.co/blog/bootloader-bypass-part1/
[4] C. Gerlinsky, “Breaking Code Read Protection on the NXP LPC-family Microcontrollers,” Jan. 2017, https://recon.cx/2017/brussels/talks/breaking_crp_on_nxp.html
[5] A. Barenghi, G. Bertoni, E. Parrinello, G. Pelosi, “Low Voltage Fault Attacks on the RSA Cryptosystem,” 2009

INSIGHTS, RESEARCH | February 23, 2021

A Practical Approach to Attacking IoT Embedded Designs (II)

In this second and final blog post on this topic, we cover some OTA vulnerabilities we identified in wireless communication protocols, primarily Zigbee and BLE.

As in the previous post, the findings described herein are intended to illustrate the type of vulnerabilities a malicious actor could leverage to attack a specified target to achieve DoS, information leakage, or arbitrary code execution.

These vulnerabilities affect numerous devices within the IoT ecosystem. IOActive worked with the semiconductor vendors to coordinate the disclosure of these security flaws, but it is worth mentioning that due the specific nature of the IoT market and despite the fact that patches are available, a significant number of vulnerable devices will likely never be patched.

As usual, IOActive followed a responsible disclosure process, notifying the affected vendors and coordinating with them to determine the proper time to disclose issues. In general terms, most vendors properly handled the disclosure process.

At the time of publishing this blog post, the latest versions of the affected SDKs contain fixes for the vulnerabilities. Please note that IOActive has not verified these patches.

OTA Vulnerabilities

Affected vendors

  • Nordic Semiconductor
  • Texas Instruments
  • Espressif Systems
  • Qualcomm

Nordic Semiconductor  – www.nordicsemi.com

Vulnerability

Integer overflow in ‘ble_advdata_search

Affected Products

nRF5 SDK prior to version 16

Background 

“The nRF5 SDK is your first stop for building fully featured, reliable and secure applications with the nRF52 and nRF51 Series. It offers developers a wealth of varied modules and examples right across the spectrum including numerous Bluetooth Low Energy profiles, Device Firmware Upgrade (DFU), GATT serializer and driver support for all peripherals on all nRF5 Series devices. The nRF5 SDK will almost certainly have something for your needs in developing exciting yet robust wireless products” https://www.nordicsemi.com/Software-and-tools/Software/nRF5-SDK

Impact

A malicious actor able to send specially crafted BLE advertisements could leverage this vulnerability to execute arbitrary code in the context of a device running a nRF5-SDK-based application. This may lead to the total compromise of the affected device.

Technical Details

At line 644, an attacker-controlled buffer pointed to by ‘p_encoded_data[i]’ may be 0x00, which will overflow ‘len’, whose value will be 0xFFFF after the operation.

This effectively bypasses the sanity check at line 645.

Exploitation

Different scenarios are possible depending on how ‘len’ is handled by the caller. In the following example, this vulnerability leads to a classic stack overflow at line 185.

Vulnerability

Incorrect DFU packet length resulting in remote code execution

Affected Products

nRF5 SDK for Mesh prior to version 4.1.0

Background 

“The nRF5 SDK for Mesh combined with the nRF52 Series is the complete solution for your Bluetooth mesh development.” https://www.nordicsemi.com/Software-and-tools/Software/nRF5-SDK-for-Mesh

Impact

A malicious actor able to initiate a DFU connection to the affected device could potentially leverage this vulnerability to execute arbitrary code in the context of the bootloader. This may lead to the total compromise of the affected device.

Technical Details

When the bootloader handles DFU messages, the length of the mesh advertising data packets is not properly checked. The vulnerable code path is as follows:

1. In ‘bootloader_init’ at line 466, the rx callback is initialized to ‘rx_cb’ by ‘transport_init’.

2. At line 211, the advertising packet queue is checked for DFU packets by calling ‘mesh_packet_adv_data_get’, which does not perform proper validation of the ‘adv_data_length’ field (e.g. by checking for a minimum value [ > 3 ]). As a result at line 217, ‘p_adv_data->adv_data_length‘ (8-bit) may wrap to a large 32-bit value, which is stored at ‘rx_cmd.params.rx.length’.

3. A ‘signature’ packet is then routed, without checking the length (truncated to 16-bit at ‘bl_cmd_handler’), through ‘bl_cmd_handler’-> ‘dfu_mesh_rx’ -> ‘handle_data_packet’ and finally ‘target_rx_data’, where the memory corruption may occur at line 861.

Vulnerability

Multiple buffer overflows when handling Advertising Bearer data packets

Affected Products

nRF5 SDK for Mesh prior to version 4.1.0

Background 

“The nRF5 SDK is your first stop for building fully featured, reliable and secure applications with the nRF52 and nRF51 Series. It offers developers a wealth of varied modules and examples right across the spectrum including numerous Bluetooth Low Energy profiles, Device Firmware Upgrade (DFU), GATT serializer and driver support for all peripherals on all nRF5 Series devices. The nRF5 SDK will almost certainly have something for your needs in developing exciting yet robust wireless products” https://www.nordicsemi.com/Software-and-tools/Software/nRF5-SDK

Impact

A malicious actor able to send malicious Advertising Bearer packets to the affected device could potentially leverage this vulnerability to execute arbitrary code. This may lead to the total compromise of the affected device.

Technical Details

The length of the Advertising Bearer data packets is not properly checked. The vulnerable code path is as follows:

1. When an AD listener is dispatched (it has been previously registered at line 1062 in ‘prov_bearer_adv.c‘), there is just one action performed to sanitize the length, at line 115 ( > 0 ).

2. The handler for Advertising Bearer packets does not perform any additional validation on the received ‘length’, which is then propagated to specific packet handling functions at lines 1035, 1047, and 1051.

3. ‘handle_transaction_start_packet’ does not perform any validation on ‘length’ before reaching lines 706 (underflow) and 707 (buffer overflow).

4. ‘handle_transaction_continuation_packet’ does not perform any validation on ‘length’ before reaching lines 759 (underflow) and 760 (buffer overflow).

Vulnerability

Buffer overflow in BLE Queued Writes

Affected Products

nRF5 SDK prior to version 16

Background 

“The nRF5 SDK is your first stop for building fully featured, reliable and secure applications with the nRF52 and nRF51 Series. It offers developers a wealth of varied modules and examples right across the spectrum including numerous Bluetooth Low Energy profiles, Device Firmware Upgrade (DFU), GATT serializer and driver support for all peripherals on all nRF5 Series devices. The nRF5 SDK will almost certainly have something for your needs in developing exciting yet robust wireless products” https://www.nordicsemi.com/Software-and-tools/Software/nRF5-SDK

Impact

A malicious actor able to send a initiate a Queued Write request to the affected device could potentially leverage this vulnerability to execute arbitrary code. This may lead to the total compromise of the affected device.

Technical Details

val_offset’ and ‘val_len’ are not properly sanitized. As a result, a malicious request containing a specific combination of both values (containing a large ‘val_len’ value) may lead to an integer overflow  at line 135, resulting in a value that can bypass the check at line 136. Finally, at line 138, the overflow occurs as ‘val_len’ is used in the memcpy operation.

Texas Instruments  – www.ti.com

Vulnerability

Z-Stack – Multiple heap overflows in ZCL parsing functions

Affected Products

SIMPLELINK-CC13X2-26X2-SDK prior to version 4.40.00.44
Other Zigbee stacks based on the Z-Stack code are also affected (i.e. Telink)

Vendor advisory: https://www.ti.com/lit/an/swra699/swra699.pdf

Background 

“Z-Stack is a component of the SimpleLink™ CC13x2 / CC26x2 Software Development Kit. This component enables development of Zigbee® 3.0 specification based products. Z-Stack is TI’s complete solution for developing certified Zigbee 3.0 solution on CC13x2 and CC26x2 platforms. Z-Stack contained in this release is based on Zigbee 3.0 specification with the added benefit of running on top of TI-RTOS.” https://www.ti.com/tool/Z-STACK

Impact

A malicious actor in possession of the NWK key (authenticated to the Zigbee Network) may send OTA malicious Zigbee ZCL packets to the victim’s node, which may result in the execution of arbitrary code in the context of the affected device.

Technical Details

Z-Stack parses the ZCL payloads by performing a two-steps flawed logic:

1. It calculates the total length of the attributes by iterating over the incoming ZCL frame payload without checking for integer overflows.

2. Dynamic memory is allocated according to this total length; however, attributes are individually copied to the parsing structure without sanitizing its length.

In the following example, the first step can be mapped to the ‘while’ loop at lines 3699-3718.

dataLen’ is intended to hold the total length of the attributes in the message. Each length is individually calculated in ‘zclGetAttrDataLength’. 

There is neither an overflow check for ‘dataLen’ nor a bounds check in the last iteration of the loop against ‘pBuf’ before adding the value to ‘dataLen’. According to this logic, an attacker can create a ZCL payload containing a specific combination of attributes that may force the ‘dataLen’ integer to be wrapped, holding a value lower than the actual total length.

Example:

#define MALICIOUS_PAYLOAD “\x00\x01\x43\x06\x00\x41\x41\x41\x41\x41\x41\x00\x02\x43\x10\x00\x41\x41\x41\x41\x41\x41\x41\x41\x41\x41\x41\x41\x41\x41\x41\x41\x00\x03\x43\xF0\xFF”    

Attribute 1: 
type: long octet string: length : 0x6 (+2)
Attribute 2: 
type: long octet string: length:  0x10 (+2)
Attribute 3:
type: long octet string: length: 0xFFF0 (+2)
Total length (truncated to 16-bit as in ‘dataLen’) = 0xC

Back in ‘zclParseInWriteCmd’, ‘dataLen’ is used to allocate the buffer where the attributes’ data will be copied. As there is no sanity check on the consistency of this memory allocation (line 3723 is allocating less memory than expected due to the ‘dataLen’ overflow), this operation may result in a memory corruption at line 3740 (memcpy) as ‘attrDataLen’ may be higher than the buffer allocated at ‘dataPtr’. 

Most of the parsing routines in ‘zclCmdTable’ are affected.

Additionally, there is an integer overflow in the way ‘zclLL_ProcessInCmd_GetGrpIDsRsp’ (also ‘zclLL_ProcessInCmd_GetEPListRsp’ and ‘zclLL_ProcessInCmd_DeviceInfoRsp’) parses the incoming message, as ‘cnt’ is not properly sanitized before allocating the buffer (line 1214). As a result, ‘rspLen’ wraps around, holding a value which is actually lower than ‘cnt’. Later on ‘cnt’ is used as the test expression in the ‘for’ loop (lines 1227) so it will end up triggering memory corruption at line 1231.

Vulnerability

EasyLink – memory corruption in ‘rxDoneCallback

Affected Products

SIMPLELINK-CC13X2-26X2-SDK prior to version 4.40.00.44

Background 

“The EasyLink API should be used in application code. The EasyLink API is intended to abstract the RF Driver in order to give a simple API for customers to use as is or extend to suit their application use cases.” http://software-dl.ti.com/simplelink/esd/simplelink_cc13x0_sdk/4.10.01.01/exports/docs/proprietary-rf/proprietary-rf-users-guide/easylink/easylink-api-reference.html

Impact

A remote attacker may send a specially crafted OTA EasyLink packet to the victim’s device, which may result in either a DoS condition or the execution of arbitrary code.

Technical Details

EasyLink does not properly validate the length of the received packet. At line 533, the attacker-controlled buffer (‘pDataEntry->data‘) is used to extract 1 byte that is then used to calculate the number of bytes that will be copied (at line 545) to the static buffer pointed to by ‘rxBuffer.payload‘ (fixed at 128 bytes).

Espressif Systems  – www.espressif.com

Vulnerability

Protocomm ‘transport_simple_ble_read’ information leak

Affected Products

ESP-IDF prior to v4.0.2 https://github.com/espressif/esp-idf

Background 

“Espressif provides basic hardware and software resources to help application developers realize their ideas using the ESP32 series hardware. The software development framework by Espressif is intended for development of Internet-of-Things (IoT) applications with Wi-Fi, Bluetooth, power management and several other system features.”  https://docs.espressif.com/projects/esp-idf/en/latest/esp32/get-started/

This bug was awarded a $2,229 bounty as part of the ESP32 bug bounty program (https://www.espressif.com/en/news/bug-bounty), which was donated by Espressif, on my behalf, to a Spanish animal rescue organization.

Impact

A remote attacker may send a specially crafted BLE packet to the victim’s device, which may result in either a DoS condition or an information leak.

Technical Details

When handling a BLE READ request from the client, ‘offset’ is not properly sanitized before copying data to the response (line 128). As a result, a malicious client may leak sensitive information from the device by setting an overly large ‘offset’ parameter in the READ request.

Qualcomm – www.qualcomm.com

Vulnerability

Api_ParseInfoElem’ improper handling of IEEE80211_ELEMID_RSN length may lead to a remote DoS

Affected Products

Qualcomm WIFI_QCA Middleware 

Background 

“The QCA4004 is an intelligent platform for the Internet of Things that contains a low-power Wi-Fi connectivity solution on a single chip. It includes a number of TCP/IP-based connectivity protocols along with SSL, allowing a low-cost, low-complexity system to obtain full-featured internet connectivity and reliable information exchange.”  https://www.qualcomm.com/products/qca4004 

Impact

A malicious actor able to send malicious 802.11 management frames to the affected device may potentially leverage this vulnerability to perform a DoS, as unmapped or invalid memory may be hit when parsing RSN IEs after a SCAN operation has been invoked.  

Technical Details

The vulnerable code path is as follows: 

1. When parsing the RSN IE, its length (‘ie_len’) is not properly sanitized against ‘len’ before calling ‘security_ie_parse’.

security_ie_parse’ does not perform any additional validation on the received ‘ie_len’. Then ‘ie_len’ is decremented at 637, 644, and 658 without performing any check for alignment or underflow, so a specific value in ‘ie_len’ makes the second condition in the ‘for’ loop (line 647) always true. 

As a result, this ‘for’ loop only depends on the first condition (where ‘cnt’ is also controlled by the potential attacker). This situation may force the ‘for’ loop to run beyond the original buffer’s bound, potentially hitting unmapped or invalid memory.

INSIGHTS, RESEARCH |

Probing and Signal Integrity Fundamentals for the Hardware Hacker, part 2: Transmission Lines, Impedance, and Stubs

This is the second post in our ongoing series on the troubles posed by high-speed signals in the hardware security lab.

What is a High-speed Signal?

Let’s start by defining “high-speed” a bit more formally:

A signal traveling through a conductor is high-speed if transmission line effects are non-negligible.

That’s nice, but what is a transmission line? In simple terms:

A transmission line is a wire of sufficient length that there is nontrivial delay between signal changes from one end of the cable to the other.

You may also see this referred to as the wire being “electrically long.”

Exactly how long this is depends on how fast your signal is changing. If your signal takes half a second (500ms) to ramp from 0V to 1V, a 2 ns delay from one end of a wire to the other will be imperceptible. If your rise time is 1 ns, on the other hand, the same delay is quite significant – a nanosecond after the signal reaches its final value at the input, the output will be just starting to rise!

Using the classical “water analogy” of circuit theory, the pipe from the handle on your kitchen sink to the spout is probably not a transmission line – open the valve and water comes out pretty much instantly. A long garden hose, on the other hand, definitely is.

Propagation Delay

The exact velocity of propagation depends on the particular cable or PCB geometry, but it’s usually somewhere around two thirds the speed of light or six inches per nanosecond. You may see this specified in cable datasheets as “velocity factor.” A velocity factor of 0.6 means a propagation velocity of 0.6 times the speed of light.

Let’s make this a bit more concrete by running an experiment: a fast rising edge from a signal generator is connected to a splitter (the gray box in the photo below) with one output fed through a 3-inch cable to an oscilloscope input, and the other through a much longer 24-inch cable to another scope input.

Experimental setup for propagation delay demonstration

This is a 21-inch difference in length. The cable I used for this test (Mini-Circuits 086 series Hand-Flex) uses PTFE dielectric and has a velocity factor of about 0.695. Plugging these numbers into Wolfram Alpha, we get an expected skew of 2.56 ns:

Calculating expected propagation delay for the experiment

Sure enough, when we set the scope to trigger on the signal coming off the short cable, we see the signal from the longer cable arrives a touch over 2.5 ns later. The math checks out!

Experimental observation of cable delay

As a general rule for digital signals, if the expected propagation delay of your cable or PCB trace is more than 1/10 the rise time of the signal in question, it should be treated as a transmission line.

Note that the baud rate/clock frequency is unimportant! In the experimental setup above, the test signal has a frequency of only 10 MHz (100 ns period) but since the edges are very fast, cable delay is easily visible and thus it should be treated as a transmission line.

This is a common pitfall with modern electronics. It’s easy to look at a data bus clocked at a few MHz and think “Oh, it’s not that fast.” But if the I/O pins on the device under test (DUT) have sharp edges, as is typical for modern parts capable of high data rates, transmission line effects may still be important to consider.

Impedance, Reflections, and Termination

If you open an electrical engineering textbook and look for the definition of impedance you’re probably going to see pages of math talking about cable capacitance and inductance, complex numbers, and other mumbo-jumbo. The good news is, the basic concept isn’t that difficult to understand.

Imagine applying a voltage to one end of an infinitely long cable. Some amount of current will flow and a rising edge will begin to travel down the line. Since our hypothetical cable never ends, the system never reaches a steady state and this current will keep flowing at a constant level forever. We can then plug this voltage and current into Ohm’s law (V=I * R) and solve for R. The transmission line thus acts as a resistor!

This resistance is known as the “characteristic impedance” of the transmission line, and depends on factors such as the distance from signal to ground, the shape of the conductors, and the dielectric constant of the material between them. Most coaxial cable and high-speed PCB traces are 50Ω impedance (because this is a round number, a convenient value for typical material properties at easily manufacturable dimensions, and more) although a few applications such as analog television use 75Ω and other values are used in some specialized applications. The remainder of this discussion assumes 50Ω impedance for all transmission lines unless otherwise stated.

What happens if the line forks? We have the same amount of current flowing in since the line has a 50Ω impedance at the upstream end, but at the split it sees 25Ω (two 50Ω loads in parallel). The signal thus reduces in amplitude downstream of the fork, but otherwise propagates unchanged.

There’s just one problem: at the point of the split, we have X volts in the upstream direction and X/2 volts in the downstream direction! This is obviously not a stable condition, and results in a second wavefront propagating back upstream down the cable. The end result is a mirrored (negative) copy of the incident signal reflecting back.

We can easily demonstrate this effect experimentally by placing a T fitting at the end of a cable and attaching additional cables to both legs of the fitting. The two cables coming off the T are then terminated (one at a scope input and the other with a screw-on terminator). We’ll get to why this is important in a bit.

Experimental setup for split in transmission line

The cable from the scope input to the split is three inches long; using the same 0.695 velocity factor as before gives a propagation delay of 0.365 ns. So for the first 0.365 ns after the signal rises everything is the same as before. Once the edge hits the T the reduced-voltage signal starts propagating down the two legs of the T, but the same reduced voltage also reflects back upstream.

Observed waveform from split test

It takes another 0.365 ns for the reflection to reach the scope input so we’d expect to see the voltage dip at around 0.73 ns (plus a bit of additional delay in the T fitting itself) which lines up nicely with the observed waveform.

In addition to an actual T structure in the line, this same sort of negative reflection can be caused by any change to a single transmission line (different dielectric, larger wire diameter, signal closer to ground, etc.) which reduces the impedance of the line at some point.

Up to this point in our analysis, we’ve only considered infinitely long wires (and the experimental setups have been carefully designed to make this a good approximation). What if our line is somewhat long, but eventually ends in an open circuit? At the instant that the rising edge hits the end of the wire, current is flowing. It can’t stop instantaneously as the current from further down the line is still flowing – the source side of the line has no idea that anything has changed. So the edge goes the only place it can – reflecting down the line towards the source.

Our experimental setup for this is simple: a six-inch cable with the other end unconnected.

Experimental setup for open circuit at end of a transmission line

Using the same 0.695 velocity factor, we’d expect our signal to reach the end of the cable in about 0.73 ns and the reflection to hit the scope at 1.46 ns. This is indeed what we see.

Observed waveform from open circuit test

Sure enough, we see a reflected copy of the original edge. The difference is, since the open circuit is a higher-than-matched impedance instead of lower like in the previous experiment, the reflection has a positive sign and the signal amplitude increases rather than dropping.

A closer inspection shows that this pattern of reflections repeats, much weaker, starting at around 3.0 ns. This is caused by the reflection hitting the T fitting where the signal generator connects to the scope input. Since the parallel combination of the scope input and signal generator is not an exact 50Ω impedance, we get another reflection. The signal likely continues reflecting several more times before damping out completely, however these additional reflections are too small to show up with the current scope settings.

So if a cable ending in a low impedance results in a negative reflection, and a cable ending in a high impedance results in a positive reflection, what happens if the cable ends in an impedance equal to that of the cable – say, a 50Ω resistor? This results in a matched termination which suppresses any reflections: the incident signal simply hits the resistor and its energy is dissipated as heat. Terminating high-speed lines (via a resistor at the end, or any of several other possible methods) is critical to avoid reflections degrading the quality of the signal.

One other thing to be aware of is that the impedance of circuit may not be constant across frequency. If there is significant inductance or capacitance present, the impedance will have frequency-dependent characteristics. Many instrument inputs and probes will specify their equivalent resistance and capacitance separately, for example “1MΩ || 17 pF” so that the user can calculate the effective impedance at their frequency of interest.

Stub Effects and Probing

We can now finally understand why the classic reverse engineering technique of soldering long wires to a DUT and attaching them to a logic analyzer is ill-advised when working with high speed systems: doing so creates an unterminated “stub” in the transmission line.

Typical logic analyzer inputs have high input impedances in order to avoid loading down the signals on the DUT. For example, the Saleae Logic Pro 8 has an impedance of 1MΩ || 10 pF and the logic probe for the Teledyne LeCroy WaveRunner 8000-MS series oscilloscopes is 100 kΩ || 5 pF. Although the input capacitance does result in the impedance decreasing at higher frequencies, it remains well over 50Ω for the operating range of the probe.

This means that if the wire between the DUT and the logic analyzer is electrically long, the signal will reflect off the analyzer’s input and degrade the signal as seen by the DUT. To see this in action, let’s do an experiment on a real board which boots from an external SPI flash clocked at a moderately fast speed – about 75 MHz.

As a control, we’ll first look at the signal using an electrically short probe. I’ll be using a Teledyne LeCroy D400A-AT, a 4 GHz active differential probe. This is a very high performance probe meant for non-intrusive measurements on much faster signals such as DDR3 RAM.

Active probe on SPI flash
Probe tip seen through microscope

Looking at the scope display, we see a fairly clean square wave on the SPI SCK pin. There’s a small amount of noise and some rounding of the edges, but nothing that would be expected to cause boot failures.

Observed SPI SCK waveform

The measured SPI clock frequency is 73.4 MHz and the rise time is 1.2 ns. This means that any stub longer than 120 ps round trip (60 ps one way) will start to produce measurable effects. With a velocity of 0.695, this comes out to about half an inch. You may well get away with something a bit longer (“measurable effects” does not mean “guaranteed boot failure”), but at some point the degradation will be sufficient to cause issues.

Now that we’ve got our control waveform, let’s build a probing setup more typical of what’s used in lower speed hardware reverse engineering work: a 12-inch wire from a common rainbow ribbon cable bundle, connected via a micro-grabber clip to a Teledyne LeCroy MSO-DLS-001 logic probe. The micro-grabber is about 2.5 inches in length, which when added to the wire comes to a total stub of about 14.5 inches.

(Note that the MSO-DLS-001 flying leads include a probe circuit at the tip, so the length of the flying lead itself does not count toward the stub length. When using lower end units such as the Saleae Logic that use ordinary wire leads, the logic analyzer’s lead length must be considered as part of the stub.)

Experimental setup with long probe stub wire (yellow)

We’d thus expect to see a reflection at around 3.5 ns, although there’s a fair bit of error in this estimate because the velocity factor of the cable is unspecified since it’s not designed for high-speed use. We also expect the reflections to be a bit more “blurry” and less sharply defined than in the previous examples, since the rise time of our test signal is slower.

Measured SPI clock waveform with long stub wire

There’s a lot of data to unpack here so let’s go over it piece by piece.

First, we do indeed see the expected reflection. For about the first half of the cycle – close to the 3.5 ns we predicted – the waveform is at a reduced voltage, then it climbs to the final value for the rest of the cycle.

Second, there is significant skew between the waveform seen by the analog probe and the logic analyzer, which is caused by the large difference in length between the path from the DUT to the two probe inputs.

Third, this level of distortion is very likely to cause the DUT to malfunction. The two horizontal cursors are at 0.2 and 0.8 times the 1.8V supply voltage for the flash device, which are the logic low and high thresholds from the device datasheet. Any voltage between these cursors could be interpreted as either a low or a high, unpredictably, or even cause the input buffer to oscillate.

During the period in which the clock is supposed to be high, more than half the time is spent in this nondeterministic region. Worst case, if everything in this region is interpreted as a logic low, the clock will only appear to be high for about a quarter of the cycle! This would likely act like a glitch and result in failures.

Most of the low period is spent in the safe “logic low” range, however it appears to brush against the nondeterministic region briefly. If other noise is present in the DUT, this reflection could be interpreted as a logic high and also create a glitch.

Conclusions

As electronics continue to get faster, hardware hackers can no longer afford to remain ignorant of transmission line effects. A basic understanding of these physics can go a long way in predicting when a test setup is likely to cause problems.

INSIGHTS, RESEARCH | February 11, 2021

A Practical Approach To Attacking IoT Embedded Designs (I)

The booming IoT ecosystem has meant massive growth in the embedded systems market due to the high demand for connected devices. Nowadays, designing embedded devices is perhaps easier than ever thanks to the solutions, kits, chips, and code that semiconductor manufacturers provide to help developers cope with the vast number of heterogeneous requirements IoT devices should comply with.

This never-ending race to come up with new features within tight deadlines comes at a cost, which usually is paid in the security posture of the commercialized device. 

Let’s assume a product vendor has implemented security best practices and everything has been locked down properly. Our goal is to compromise the device, but we don’t have access to any of the custom code developed for that specific device (not even in binary form). What about the code semiconductor vendors provide? How secure is the code in all those SDKs and middleware that IoT devices rely on?

I performed a manual code review of some of the most widely used IoT SDKs in order to try to answer this question and found multiple vulnerabilities in the code provided by leading semiconductor vendors, such as Texas Instruments, Nordic, and Qualcomm. 

As usual, IOActive followed a responsible disclosure process, notifying the affected vendors and coordinating with them to determine the proper time to disclose issues. In general terms, most vendors properly handled the disclosure process.

At the time of publishing this blog post, the latest versions of the affected SDKs contain fixes for the vulnerabilities. Please note that IOActive has not verified these patches.

Introduction

Embedded IoT systems need to be designed for specific functions. As a result, we can’t use a single reference design; however, it is possible to summarize the most common architectures.

SoC

These designs rely on an SoC that combines the MCU and communications transceiver into a single-chip solution. Thus, the wireless software stack and the application software run in the same component.

MCU + Transceiver

In these designs, the MCU is in charge of running the required software, including the applications and even part of the wireless stack, and the transceiver usually handles the physical and data link layers. In addition, there is a host interface (HIF), which is responsible for handling communication between the MCU (Host) and the transceiver, usually over a serial bus (e.g. SPI, UART, or I2C).

MCU + Network Co-Processor

These designs are a variant of the previous one, where the transceiver is swapped for a network co-processor (NCP), which runs the entire communications stack. In this architecture, the application is still running in the MCU (Host), while the network stack operations are entirely offloaded to the NCP. The HIF is still necessary to enable communication between the Host and NCP.

Attack Surface

As we have just outlined, the components within an embedded IoT design do not operate in isolation. They interact with the outside world via wireless and at the intra-board level with other chips.

1. Intra-board

Most current high-end MCUs and SoCs support some kind of secure boot or code integrity mechanism. Assuming a worst-case scenario (from an attacker’s perspective) where the vendor has closed the usual doors before deploying the product, we may face a pure black-box scenario, where we can’t dump or access the firmware.

In order to turn this situation to our favor, we can focus on the HIF code usually found in the SDKs from semiconductor vendors.  

The advantage we have in this scenario is that, despite the fact that the firmware running in the Host MCU (Host from now on) may be unknown, analysis of HIF communications may reveal that the Host firmware has been compiled with potentially vulnerable SDK code. 

 A successful exploit targeting the HIF implementation could open the door to execute code in the Host if a local attacker has the ability to impersonate the transceiver/NCP over the HIF’s bus (SPI, UART, I2C, USB, etc.). At IOActive, we have been exploiting this attack vector for years in order to compromise among other devices, smart meters, which usually implement either an ‘MCU + NCP’ or ‘MCU + Transceiver’ design. 

The vulnerabilities described in this post are intended to illustrate common patterns in the HIF layer implementation across different vendors, all of which lacked proper validation features. One of the advantages of intra-board attacks is that they can be used not only to discover memory corruption vulnerabilities, but much more interesting logic flaws, as Host firmware may not account for an attacker hijacking intra-board communication.

2. Wireless

From an attack surface perspective, the situation is similar to intra-board attacks. An attacker may lack access to the firmware, but it still possible to target the semiconductor vendor’s stack, usually provided in the corresponding component SDK. 

This research focused on BLE and Zigbee stacks, which are some of the most common wireless communication interfaces used in the IoT ecosystem. The second part of this blog post series will cover these vulnerabilities.

Intra-board Vulnerabilities

Affected vendors

  • Texas Instruments
  • Qualcomm
  • Silicon Labs
  • Zephyr OS
  • Microchip
  • Infineon

Texas Instruments  – www.ti.com

Vulnerability 

Memory corruption via ‘NPITLSPI_CallBack’ 

Affected Products

CC1350 SDK, BLE-STACK (SDK v4.10.01 and prior versions)
CC26x0 BLE-STACK (v2.2.4 and prior versions)

Texas Instruments Advisory: https://www.ti.com/lit/an/swra684/swra684.pdf 

Background 

TI’s Network Processor Interface (NPI) is used for establishing a serial data link between a TI SoC and external MCUs or PCs. It is an abstraction layer above the serial interface (UART or SPI) that handles sending / receiving data power management, and data parsing It is mainly used by TI’s network processor solutions.” Texas Instruments Website

Impact

A local attacker able to interfere with the physical SPI bus between the Host and NCP could send a malformed UNPI packet that corrupts dynamic memory in the Host, potentially achieving code execution.

Technical Details

When ‘NPITLSPI_CallBack’ parses the UNPI packet coming from the Slave, it does not properly verify whether the 16-bit length is within the bounds of ‘npiRxBuf’.  

At lines 210-211, ‘readLen’ is directly calculated from the untrusted input coming from the slave.

Assuming that the local attacker will either guess or force a deterministic FCS by taking into account the malloc implementation, the memory corruption will take place at line 221. 

npiRxBuf’ is initialized at line 193, using the default value of 530 bytes.

Qualcomm  – www.qualcomm.com

Vulnerability

Multiple buffer overflows when parsing malformed WMI packets in the ‘Wifi_qca’ middleware

Affected Products

Products that use the Qualcomm Atheros WIFI_QCA middleware: https://www.qualcomm.com/products/qca4004

Background 

“The Wireless Module Interface (WMI) is a  communication protocol for QCA wireless components. It defines a set of commands that can be issued to the target firmware or that the target firmware can send back to the host for processing. This WMI communication is happening over the defined HIF layer.”

Impact

A local attacker able to interfere with the physical SPI bus between the Host and target QCA SoC could send a malformed WMI packet that corrupts kernel memory in the Host, thus potentially achieving local code execution with kernel privileges.

Technical Details

There are multiple places in the QCA middleware where WMI messages coming from the device are not properly validated.

#1 ‘WMI_GET_CHANNEL_LIST_CMDID’

When processing ‘WMI_GET_CHANNEL_LIST_CMDID’ at ‘wmi_control_rx’ there is no sanity check for the attacker-controlled value ‘CHAN_EV->numChannels’.

Api_ChannelListEvent’ then uses ‘numChan’ to calculate the number of bytes, without performing any bounds checking, that will be copied into the fixed buffer ‘pDCxt->ChannelList’.

This buffer is defined within the Driver Context structure at line 256. In terms of exploitability, an attacker could easily overwrite a function pointer at line 272 with controlled values.

#2 ‘WMI_STORERECALL_STORE_EVENTID’

When processing ‘WMI_STORERECALL_STORE_EVENTID’ at ‘wmi_control_rx’, there is no sanity check for the ‘len’ value, in order to verify it is not larger than ‘pDCxt->tempStorageLength’. As a result, an overly large WMI packet could corrupt the fixed-length buffer pointed to by ‘strrclData’. This buffer is initialized at ‘Custom_Driver_ContextInit’.

This buffer is initialized at ‘Custom_Driver_ContextInit’.

#3 ‘WMI_HOST_DSET_STORE_EVENTID’

At ‘Api_HostDsetStoreEvent’,’dset_length’ is an attacker-controlled value. At line 418, there is an integer overflow which could bypass the ‘if’ condition. As a result, ‘dset_length’ can still be larger than ‘pDCxt->tempStorageLength’, leading to memory corruption.

Any other code relying on ‘dset_length’ may also be vulnerable (e.g. ‘Api_HostDsetReadEvent’).

#4 ‘WMI_P2P_NODE_LIST_EVENTID’

When processing ‘WMI_P2P_NODE_LIST_EVENTID’ messages coming from the device, the attacker-controlled value ‘num_p2p_dev’ is not sanitized. As a result, at line 1399 it is possible to corrupt the fixed-length buffer pointed to by ‘tmpBuf’, which is ‘pCxt->pScanOut’ (actually, it is ‘pDCxt->tempStorage’, which has been previously explained).

Silicon Labs – www.silabs.com

Vulnerability

Buffer overflow in ‘sl_wfx_get_pmk

Affected Products

Silicon Labs’ FMAC WFx driver: https://github.com/SiliconLabs/wfx-fullMAC-driver/

Background

The WFx FMAC driver is a software resource meant to allow a host to communicate with the WFx Wi-Fi transceiver. The API exposed by the driver gives control over the WFx Wi-Fi capabilities. In addition, the API enables data transfer at the IP level. This means that the host requires an IP stack if it wants to send/receive Ethernet frames.

https://docs.silabs.com/wifi/wf200/rtos/latest/wfx-fmac-driver

Impact

A local attacker able to interfere with the physical SPI/SDIO bus between the Host and the Silicon Labs NCP could forge a malformed WFx response frame that corrupts memory in the Host, thus potentially achieving local code execution.

Technical Details

sl_wfx_get_pmk’ does not sanitize ‘reply->body.password_length’, by either comparing it to ‘password_length’ value or checking against SL_WFX_PASSWORD_SIZE, before copying it (line 1119) into the provided buffer. As a result, there is no guarantee that the buffer pointed by ‘password’ can safely receive the length specified in the response.

Vulnerability

Kernel memory corruption when decoding ‘Secure Channel’ HIF frame

Affected Products

Silicon Labs’ WFx Linux driver: https://github.com/SiliconLabs/wfx-linux-driver

Background

Silicon Labs’ WF(M)200 chips have the ability to encrypt the SPI or SDIO serial link between the Host and the device. 

Impact

A local attacker able to interfere with the physical SPI/SDIO bus between the Host and the Silicon Labs NCP could send a malformed HIF frame that corrupts kernel memory in the Host, thus potentially achieving local code execution with kernel privileges.

Technical Details

The driver handles attacker-controlled inputs (lines 78-80) when the HIF protocol is using the ‘secure channel functionality,’ even before the proper sanity check on the ‘hif->len’ field is performed (at line 94). As a result, the computed length for the HIF frame would be different from the actual ‘read_len’.

clear_len’ is controlled by the attacker, so ‘payload_len’, ‘tag’ and ‘output’ are also indirectly controlled to some extent (lines 51-54). At line 69, ‘mbedtls_ccm_auth_decrypt’ is invoked to decrypt the HIF payload using ‘payload_len’ with the ‘skb->data’ buffer as output. As the length of ‘skb->data’ may be different than ‘payload_len’, it is possible to corrupt that memory chunk. 

The actual memory corruption happens at line 146 in CTR_CRYPT as ‘dst’ is pointing to HIF’s payload.

Zephyr OS – www.zephyrproject.org

Vulnerability

Multiple buffer overflows in the ‘Zephyr’ eswifi driver

Affected Products

Zephyr RTOS 2.3.0:

  • – https://github.com/zephyrproject-rtos/zephyr
  • – https://www.zephyrproject.org/

Impact

A local attacker able to interfere with the physical SPI bus between the Host and target controller could send a malformed SPI response that corrupts kernel memory in the Host, thus potentially achieving local code execution with kernel privileges.

Technical Details

#1 ‘__parse_ipv4_address’ buffer overflow

This function does not properly verify that ‘byte’ is within IP’s bounds (4 bytes) when parsing the IPv4 address. As a result, a malformed IP string with an overly large number of ‘dots’ will corrupt the ‘ip’ buffer. 

This vulnerability results in a stack overflow at lines 243 and 286.

#2 ‘__parse_ssid’ buffer overflow 

A similar situation can be found in ‘__parse_ssid’, which extracts and then copies the quoted SSID coming from the SPI response without checking its length. 

This vulnerability also ends up in a stack overflow scenario according to the following vulnerable path:

1.

2.

3.

Microchip – www.microchip.com

Vulnerability

Multiple vulnerabilities in ‘CryptoAuth Lib’  3.2.2

Affected Products

Microchip CryptoAuth Lib v3.2.2 : https://github.com/MicrochipTech/cryptoauthlib
Patched  https://github.com/MicrochipTech/cryptoauthlib/releases/tag/v3.2.3

Background

Designed to work with CryptoAuthentication devices such as the ATECC608B, ATSHA204A or ATSHA206A and to simplify your development, the CryptoAuthLib is a software support library written in C code. It is a component of any application or device driver that requires crypto services from the CryptoAuthentication devices. It works on a variety of platforms including Arm® Cortex®-M based or PIC® microcontrollers, PCs running the Windows® operating system or an embedded Linux® platform

Microchip Website

Impact

A local attacker able to partially emulate a malicious of Crypto Authentication device through USB could send malformed KIT protocol packets that corrupt memory in the Host, thus potentially achieving code execution.

Technical Details

When ‘kit_phy_receive’ is receiving the KIT packet from the device, it does not properly verify whether the total amount of bytes received is within the bounds of ‘rxdata’.  

The reading loop’s condition is merely ‘continue_read == true’ without taking into account ‘rxsize’, at line 324.

At line 308, we can see how the logic constantly tries to read a fixed amount of one byte from the USB device.

At line 316, ‘total_bytes_read’ is incremented by ‘bytes_read’. As the attacker controls the input, it is possible to evade the check for ‘\n’ at line 319. As a result, ‘total_bytes_read’ will be incremented beyond ‘rxsize’, thus overflowing ‘rxdata’ at line 308 during the call to ‘fread’. 

A similar issue can also be found in ‘kit_phy_receive’, although in this case instead of just one byte, it is reading CDC_BUFFER_MAX to a local stack buffer at line 263. ‘bytes_to_cpy’ is used to increment the offset (‘total_bytes’) (line 288) where the bytes will be copied (line 287). 

A similar situation is found below, where the function is constantly trying to read ‘cfg->atcahid.packetsize + 1)’ and then copy to ‘rxdata’ at lines 365 without performing any bounds checking.

Infineon – www.infineon.com

Vulnerability

Memory corruption via ‘DtlsRL_Record_ProcessRecord’ 

Affected Products

Optiga Trust X DTLS: https://github.com/Infineon/optiga-trust-x/tree/master/optiga/dtls

Background

Infineon Website

Impact

A local attacker able to interfere with the physical I2C bus between the Host and Optiga Trust X security chip could send a malformed DTLS record that corrupts heap memory in the Host, thus potentially achieving local code execution.

Technical Details

During the DTLS handshake, the fragment length field of a DTLS record is not properly sanitized. 

PpsRecData->psBlobInOutMsg->prgbStream’ points to a dynamically allocated buffer whose size is fixed (TLBUFFER_SIZE 1500 bytes).

The vulnerable path would be as follows: 

  1. DtlsHS_Handshake 
  2. DtlsHS_ReceiveFlightMessage
  3. DtlsRL_Recv
  4. DtlsCheckReplay 
  5. DtlsRL_CallBack_ValidateRec
  6. DtlsRL_Record_ProcessRecord

Vulnerability

Memory corruption via ‘CmdLib_CalcHash’ 

Affected Products

Optiga Trust X: https://github.com/Infineon/optiga-trust-x/

Impact

A local attacker able to interfere with the physical I2C bus between the Host and Optiga Trust X security chip could send a malformed ‘CmdLib_CalcHash’ response that corrupts memory in the Host, thus potentially achieving local code execution.

Technical Details

In the ‘CmdLib_CalcHash’ function, a potentially untrusted length field is used without being sanitized. 

The tag length is directly obtained from the response buffer at line 1757, which could contain a value larger than ‘PpsCalcHash->sOutHash.wBufferLength’.Then at line 1758, this length is used to perform a ‘memcpy’ operation that will trigger the memory corruption. The same issue applies to lines 1772 and 1773.

Vulnerability

Multiple memory corruption issues in ‘Optiga_cmd.c’  

Affected Products

Optiga Trust M: https://github.com/Infineon/optiga-trust-m/

Background

Impact

A local attacker able to interfere with the physical I2C bus between the Host and Optiga Trust M security chip could send a malformed response that corrupts memory in the Host, thus potentially achieving local code execution.

Technical Details

In the ‘optiga_cmd_gen_keypair_handler’ function, a potentially untrusted length field is used without being sanitized. 

The private key tag length is directly obtained from the response buffer at line 2576, which could contain a value larger than the buffer pointed by ‘p_optiga_ecc_gen_keypair->private_key’. Then at line 2579, this length is used to perform a ‘memcpy’ operation that will trigger the memory corruption. 

The same issue applies to lines 3068 and 3072 while processing the ‘Calc_Hash’ response in function ‘optiga_cmd_calc_hash_handler’.