If you have ever been part of a Red Team engagement, you will be familiar with the “Get out of Jail Free Card”. In a nutshell, it’s a signed document giving you permission to perform the activity you were caught doing. In some instances, it’s the difference between walking away and spending the night in a jail cell. You may be saying, “Ok, but what does a Get out of Jail Free Card have to do with iOS applications?”
Well, iOS mobile application assessments usually occur on jailbroken devices, and application developers often implement measures that seek to thwart this activity. The tester often has to come up with clever ways of bypassing detection and breaking free from this restriction, a.k.a. “getting out of jail”. This blog post will walk you through the steps required to identify and bypass frequently recommended detection routines. It is intended for persons who are just getting started in reverse engineering mobile platforms. This is not for the advanced user.
Environment Setup
§ Jailbroken iPhone 4S (iOS 7.xx)
§ Xcode 6.4 (command-line tools)
§ IDA Pro or Hopper
§ Mac OS X
Intro to ARM Architecture
Before we get started, let’s cover some very basic groundwork. iOS applications are compiled to native code for the ARM architecture running on your mobile device. The ARM architecture defines sixteen 32-bit general-purpose registers, numbered from R0-R15. The first 12 are for general-purpose usage, and the last three have special meaning. R13 is denoted as the stack pointer (SP), R14 the link register (LR), and R15 the program counter (PC). The link register normally holds the return address during a function call. R0-R3 hold arguments passed to functions with R0 storing the return value. For the purposes of this post, the most important takeaway is that register R0 holds the return value from a function call. See the references section for additional details on the ARM architecture.
Detecting the Jailbreak
When a device is jailbroken, a number of artifacts are often left behind. Typical jailbreak detection routines usually involve checking for those artifacts before allowing access to the application. Some of the checks you will often see include checking for:
- Known file paths
- Use of non-default ports such as port 22(OpenSSH), which is often used to connect to and administer the device
- Symbolic links to various directories (e.g. /Applications, etc.)
- Integrity of the sandbox (i.e. a call to fork() should return a negative value in a properly functioning sandbox)
In addition to the above, developers will often seek to prevent us from debugging the process with the use of PT_ATTACH_DENY, which prevents the use of the ptrace() system call (a call used in the debugging of iOS applications). The point is, there are a multitude of ways developers try to thwart our efforts as pen testers. That discussion, however, is beyond the scope of this post. You are encouraged to check out the resources included in the references section. Of the resources listed, The Mobile Application Hackers Handbook does a great job covering the topic.
Simple PoC
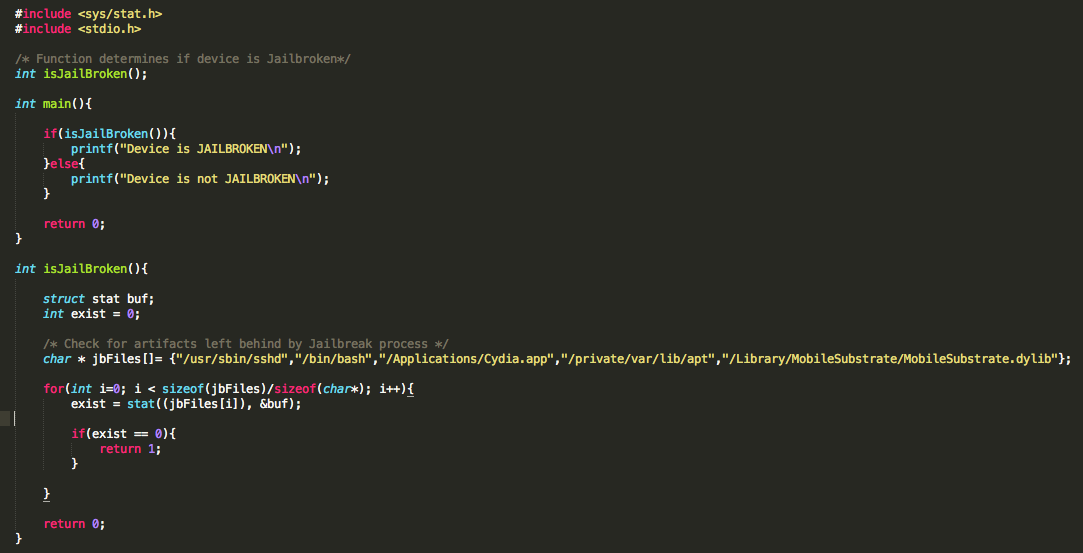
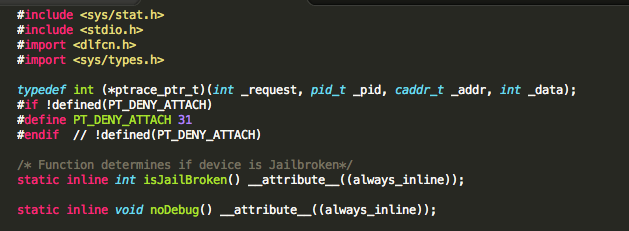
We begin with bypassing routines that check for known file paths. This approach will lay the foundation for bypassing the other checks later on. To demonstrate this, I wrote a very simple PoC that checks for the existence of some these files. In the event one is found, the program prints out a message stating the device is jailbroken. In a real world scenario, the application may perform a number of actions that include, but are not limited to, preventing you from accessing the application entirely or restricting access to parts of the application.
Figure 1: Jailbreak detection PoC
If you have a jailbroken device and would like to test this for yourself, you can use clang – the Clang C, C++, and Objective-C compiler to compile it from your Mac OS host. Refer to the man page for details on the following command.
clang -framework Foundation -arch armv7 -isysroot /Applications/Xcode.app/Contents/Developer/Platforms/iPhoneOS.platform/Developer/SDKs/iPhoneOS.sdk/ jailbreak.c -o jailbreak -miphoneos-version-min=5.0
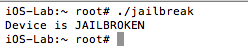
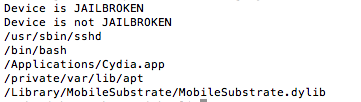
Once compiled, simply copy the binary to your jailbroken device and execute it from the command line. On a side note, Objective-C is a strict superset of C, and in most instances you will see jailbreak detections implemented in C/C++. A sample run of the program reveals that the device is jailbroken:
Figure 2: PoC execution showing device is jailbroken
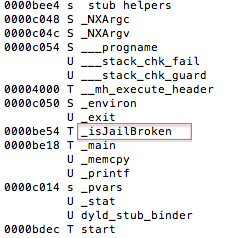
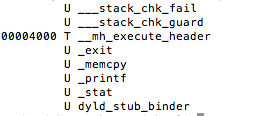
One of the first steps during an assessment is static analysis on the binary. Let’s begin by viewing the symbols with the following command nm jailbreak
Figure 3: Static analysis – extracting symbol information
Luckily for us, symbols have not been stripped, and based on the above, the _isJailBrokenmethod looks like the function responsible for determining the state of the device.
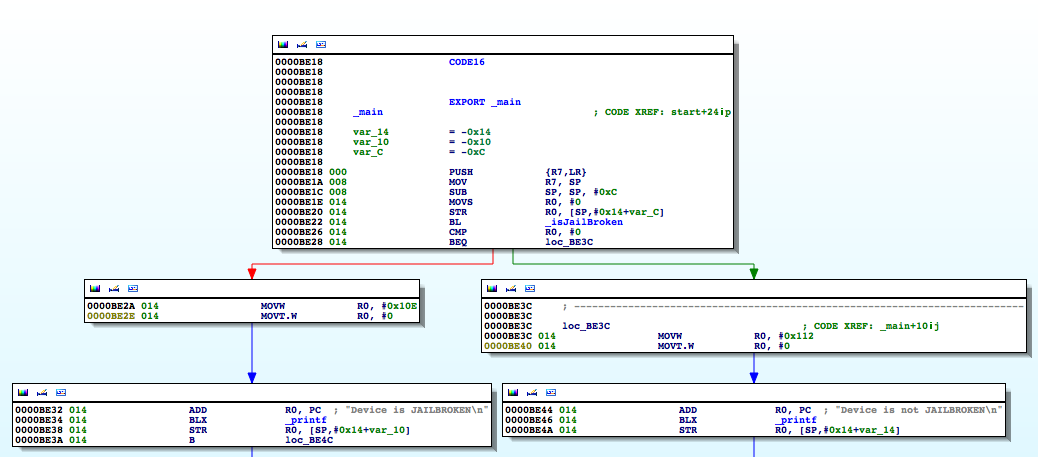
Figure 4: Examining the binary in IDA
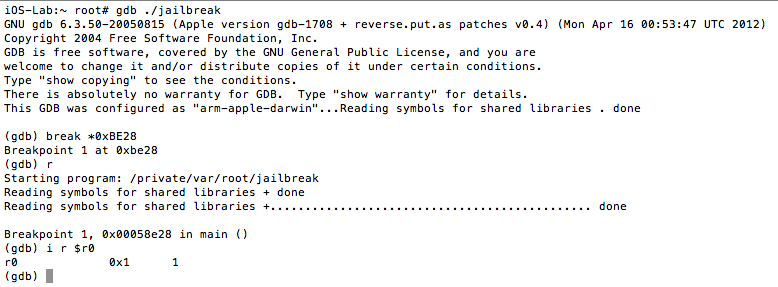
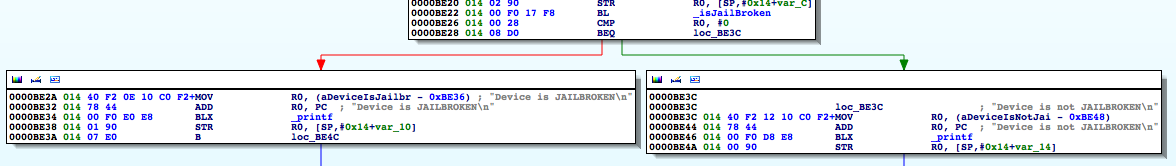
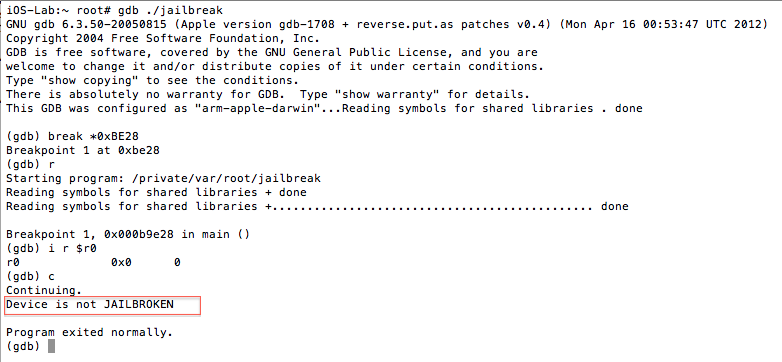
The isJailBrokenmethod is called at 0000BE22, after which the value in R0 is compared to 0. Recall from earlier that the return value from a function call is stored in the R0 register. Let’s confirm this in gdb. We will set a break point at 0000BE28the BEQ (branch if eq) instruction and examine the contents of the R0 register.
Figure 5: Examining the contents of the R0 register
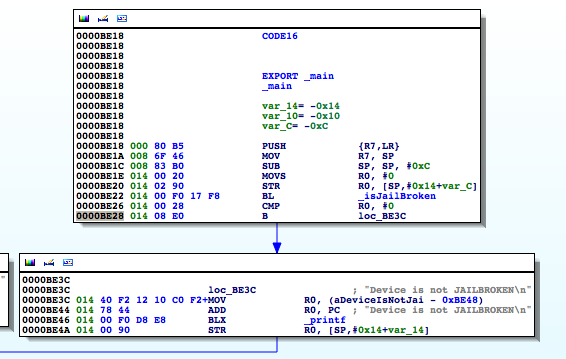
As expected the value at R0 is 1, and the program takes the branch that prints the message “Device is JAILBROKEN”. Our goal then is to take the other branch. Let’s examine the isJailBroken function.
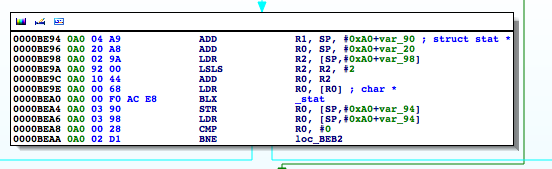
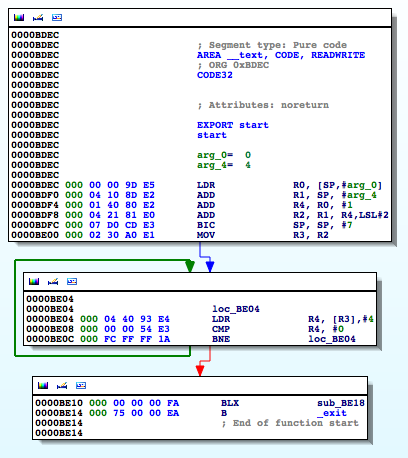
Figure 6: isJailBroken function analysis
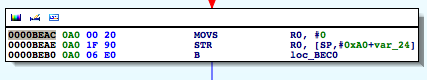
At 0000BEA0, the stat function is called, and at 0000BEA8, R0 is compared to 0. If the value is not zero, meaning the path hasn’t been found, the program processes the next file path in the jbFiles[] array shown in the PoC earlier on. However, if the path was found, we see R0 is set to 1 before the program returns and eventually exits.
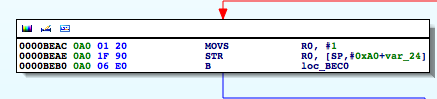
Figure 7: Determining where R0 register is set
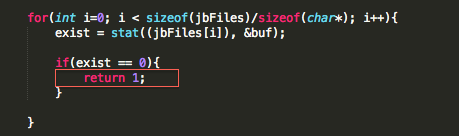
This above snippet corresponds to the following section in our PoC:
Figure 8: R0 gets set to 1 if artifact found
So if we update this, and instead of moving 1 in R0 we move a 0, we should be able to bypass the jailbreak detection check and thus get of jail. Let’s make this modification and run our binary again.
Figure 9: Updating R0 register to 0
Linking this to our PoC, it is the equivalent of doing:
Figure 10: Effect of setting R0 to 0
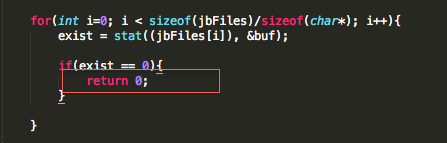
In other words, the isJailBroken function will always return 0. Let’s set another breakpoint after the comparison like we did before and examine the value in R0. If we are right, then according to the following snippet, we should branch to loc_BE3C and defeat the check.
Figure 11: PoC snippet
As expected the value is now 0, and when we continue program execution we get our desired result.
Figure 12: Bypassing the detection
But what if the binary has been stripped?
Earlier we said that we were lucky because the binary was not stripped, so we had the symbol information. Suppose however, that the developer decided to make our job a bit more difficult by stripping the binary (in our case we used strip <binaryname>). In this case, our approach would be a bit different. Let’s first look at the stripped binary using the nm tool:
Figure 13: Stripped binary
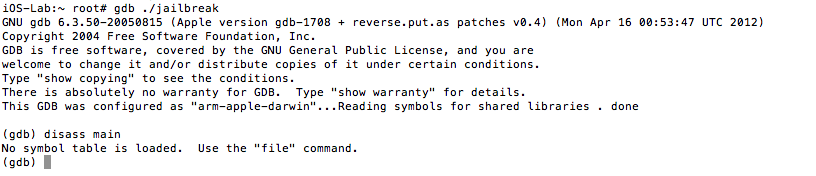
And then with gdb on the jailbroken mobile device:
Figure 14: Examining the stripped binary in gdb
It should be immediately clear that we now have a lot less information to work with. In the case of gdb, we now see “No symbol table is loaded”. Where has our isJailBrokensymbol gone? Let’s push ahead with our analysis by running strings on the binary.
Figure 15: Extracting strings from the binary
Ok, so we seem to be getting closer as we can see some familiar messages. Let’s head back to IDA once again:
Figure 16: Disassembled stripped binary
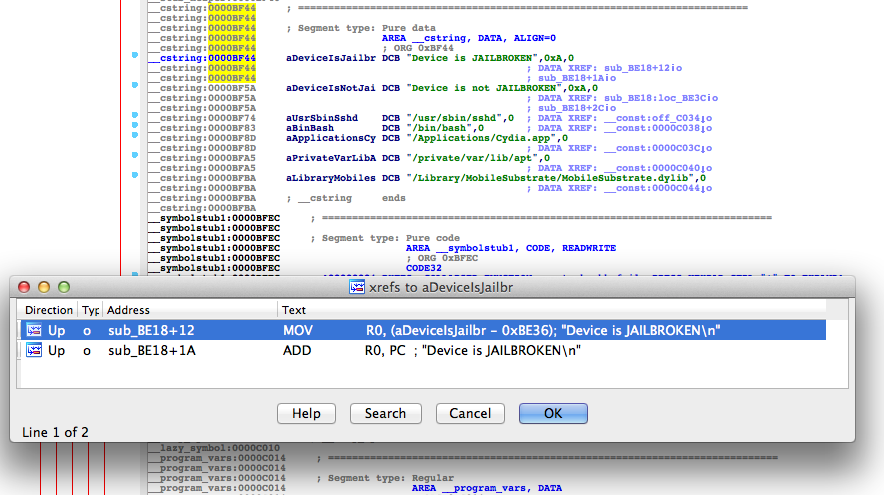
This certainly looks different from what we saw when the symbols were included. Nonetheless, let’s find the references to the strings we saw earlier. You can use the strings view in IDA and then use Ctrl+X to find all references to where they are used.
Figure 17: Locating references to the status message
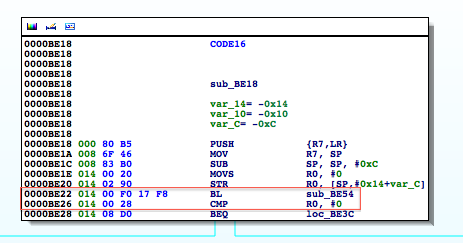
Navigating to the highlighted location, we again see the familiar CMP R0, #0:
Figure 18: Locating CMP R0, #0
And if we go to the highlighted sub_BE54, we end up in our isJailBroken function. From that point on, it’s a repeat of what we already discussed.
Ok, but the functions are now inline
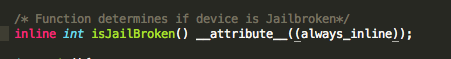
Another practice that is often recommended is to inline your functions. This causes the compiler to embed the full body of the function, as opposed to making a function call. With this in mind, our modified isJailBroken function declaration now looks like this:
Figure 19: Declaring functions inline
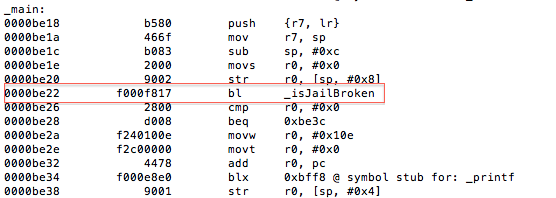
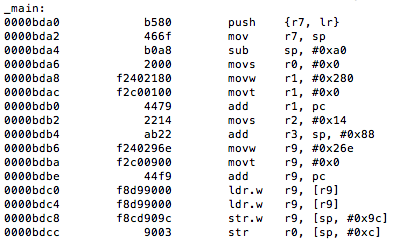
Before we continue, let’s remind ourselves of what the disassembled binary looked like prior to this change:
Figure 20: Binary before inline function
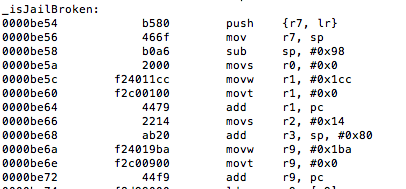
Now, let’s examine the modified binary:
Figure 21: Modified binary with function now inline
The _isJailBrokenmethod has now been inlined, and we no longer see the call(bl) instruction at 0000BE22 as before. Note that the original function body is still stored in the binary:
Figure 22: Function body still stored despite being inline
To prevent this, some very astute developers will go a step further and make the function static thereby removing the function body. The new function declaration will now be:
Figure 23: Static inline function
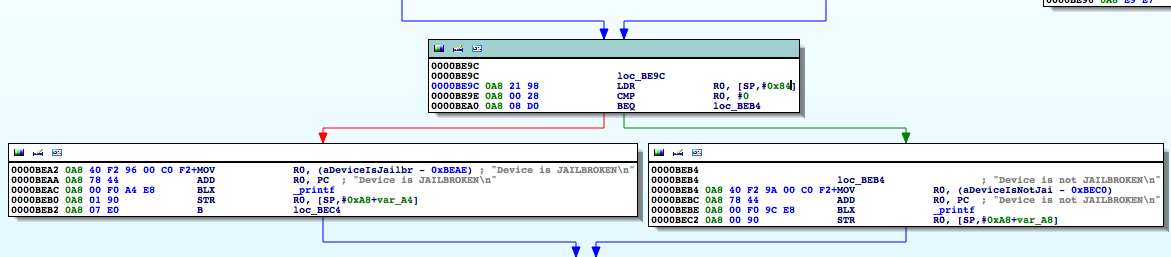
Again let’s look at this in IDA.
Figure 24: Disassembled inline binary
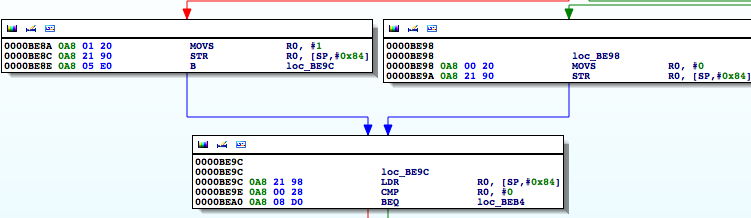
Instead of R0 being set from a function call as we saw previously, it is set from a value read from the stack using the LDRcommand at 0000BE9C. On closer examination we see the R0 register being set at 0000BE8Aand 0000BE98 and then stored on the stack:
Figure 25: Disassembled inline binary
At this point it’s the same process as before, we just need to move a 0 into R0at location 0000BE8A. And the rest is history.
Let’s block debugging then
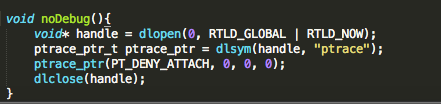
We hinted at this earlier, when we said that the ptrace() system call is used when debugging an application. Let’s examine one implementation often used by developers:
Figure 26: ptrace function declaration
Figure 27: ptrace implementation
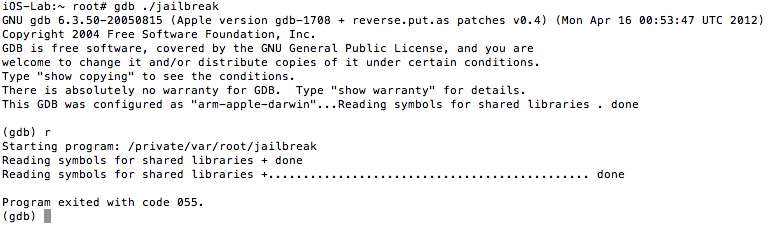
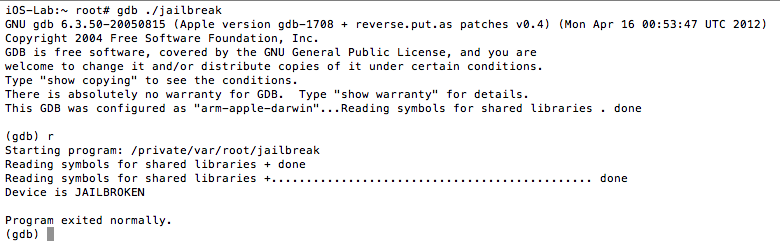
See the references section for additional details and source of the above code snippet. If we run our modified binary on the device and try to debug it as we have been doing with gdb, we are presented with the following:
Figure 28: Unable to use gdb
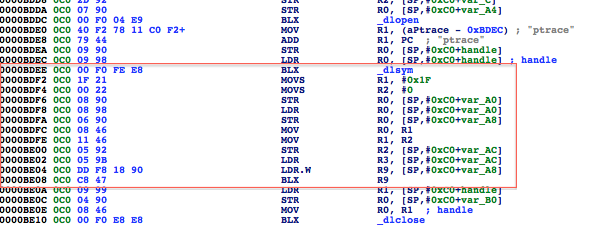
We were stopped in our tracks. Also, keep in mind that the function was inlined and the binary stripped of symbols. Examining it in IDA reveals the following:
Figure 29: Disassembled binary with call to ptrace_ptr
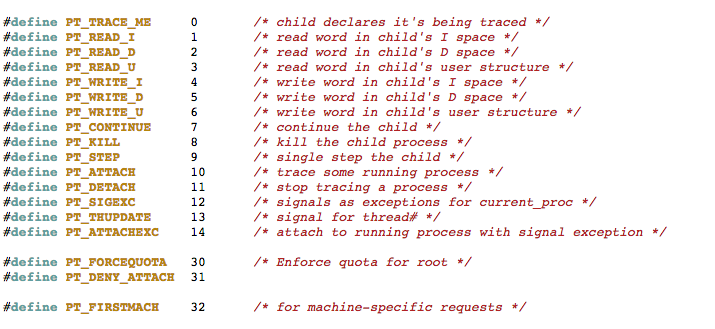
Pay special attention to the highlighted area. Recall from earlier, we said function arguments are in registers R0-R3. The ptrace_ptr call takes four arguments the first being PT_DENY_ATTACH with a value of 31. The /usr/include/sys/ptrace.h header file reveals the list of possible values:
Figure 30: Snippet ptrace documentation
So what happens if we pass a value that is outside of the expected values? The parameter is set at 0000BDF2 and later passed as the parameter to ptrace_ptrat 0000BDFC. We see a value of 1F, which translates, to 31 in decimal. Lets update this to 0x7F.
Figure 31: Updating PT_DENY_ATTACH to random value
We copy the modified binary back to our device and have our bypass.
Figure 32: Bypassing PT_DENY_ATTACH
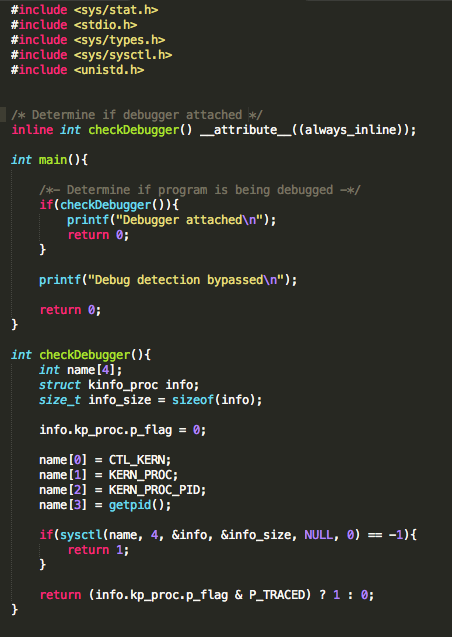
Another oft recommended technique for determining if a debugger is attached is the use of the sysctl()function. Now it doesn’t explicitly prevent a debugger from being attached, but it does return enough information for you to determine whether you are debugging the application. The code is normally a variation of the following:
Figure 33: Using sysctl()
When we run this from gdb, we get:
Figure 34: Output from running with sysctl()
Let’s pop this in IDA. Again the binary has been stripped and the checkDebugger function inlined.
Figure 35: Call to sysctl()
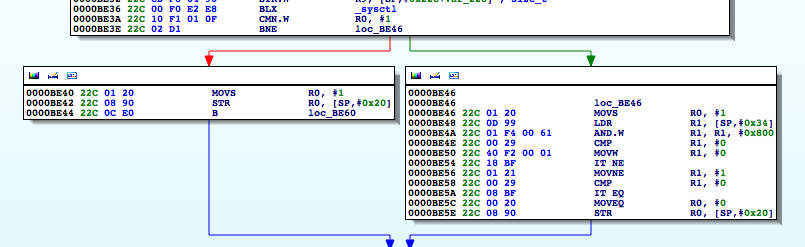
At 0000BE36we see the sysctl() function call and at 0000BE3A we see the comparison of register R0 to -1. If the call was not successful, then at 0000BE40 the program copies 1 to R0 before returning. That logic corresponds to:
Figure 36: Code snippet showing call to sysctl()
The fun begins when sysctl() was successful. We see the following snippet:
Figure 37: A look at the ternary operator
This corresponds to the following code snippet:
Figure 38: Ternary operator in our source code
When the application is being debugged/traced, the kernel sets the P_TRACED flag for the process where P_TRACED is defined in /usr/include/sys/proc.h as:
Figure 39: P_TRACED definition in /usr/include/sys/proc.h
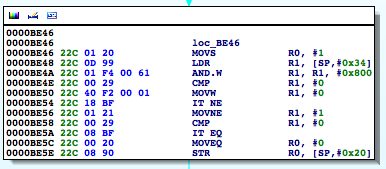
So at 0000BE4Awe see the bitwise AND against this value. In effect, the loc_BE46 block corresponds to the above ternary operator in the return statement. What we want then is for this call to return 0.
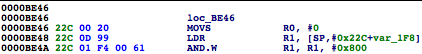
If we change the instruction at 0000BE46 to a MOVS R0, 0 instead:
Figure 40: Patching the binary
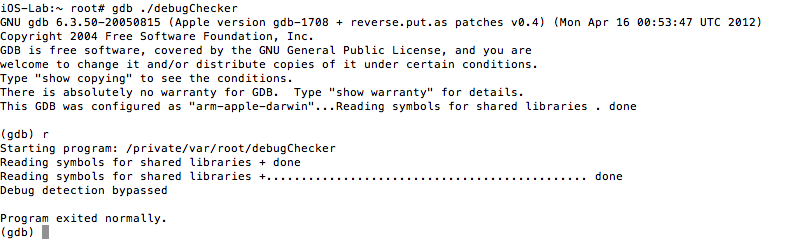
When we run the program again we get
Figure 41: Successful bypass
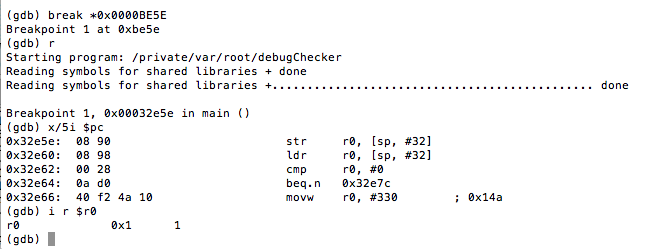
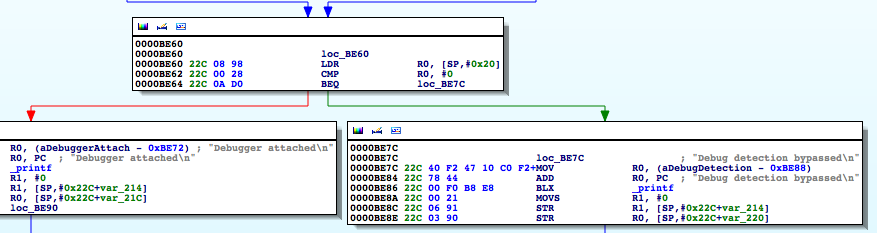
Now, you may be asking, how did we know to update that specific instruction? Well, as we said, the loc_BE46 block corresponds to the use of the ternary operator in our code. Now don’t allow the compiler’s representation of the operator to confuse you. The ternary operator says if the process is being traced return 1 otherwise return 0. At 0000BE46 R0 is set to 1, and R0is also set at 0000BE5C.[EW1] However, in the latter case, the register is set in a conditional block. That block gets hit when the check returns 0. In other words, the process is not being traced. Let’s look at this in gdb. We will set a breakpoint at 0000BE5E, the point at which R0gets stored on the stack at [sp,#0x20].
Figure 42: Inspecting the R0 register
As you can see, R0has a value of 1, and this was set at 0000BE46 as discussed earlier. This value is then written to the stack and later accessed at 0000BE60 to determine if the process is being traced. We see the comparison against 0 at 0000BE62, and if it’s true, we take the path that shows we bypassed the debug check.
Figure 43: Reversing the binary
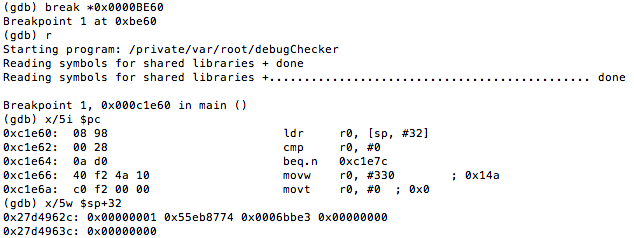
So, if we set a breakpoint at 0000BE60 and look what value was read from the stack, we see the following:
Figure 44: Examining the value in R0 that will be checked to determine if process is being debugged
This value(0x00000001) is the 1 that was copied to R0 earlier on. Hence, updating this to 0 helps achieve our goal.
Bringing down the curtains
Before we go, let’s revisit our very first example:
Figure 45: Revisiting first example
Recall we modified the isJailBroken function by setting register R0 to 0. However, there is a much simpler way to achieve our objective, and some of you would have already picked it up. The instruction at 0000BE28 is BEQ (branch if eq), so all we really need to do is change this to an unconditional jump to loc_BE3C. After the modification we end up with:
Figure 46: Updated conditional jump to unconditional jump
And we are done, however, we had to take the long scenic route first.
Conclusion
As we demonstrated, each time the developer added a new measure, we were able to bypass it. This however does not mean that the measures were completely ineffective. It just means that developers should implement these and other measures to guard against this type of activity. There is no silver bullet.
From a pen tester’s stand point, it comes down to time and effort. No matter how complex the function, at some point it has to return a value, and it’s a matter of finding that value and changing it to suit our needs.
Detecting jailbreaks will continue to be an interesting topic. Remember, however, that an application running at a lower privilege can be tampered with by one that is at a higher privilege. A jailbroken device can run code in kernel-mode and can therefore supply false information to the application about the state of the device.
Happy hacking.
References:
- http://www.amazon.com/The-Mobile-Application-Hackers-Handbook/dp/1118958500
- http://www.amazon.com/Practical-Reverse-Engineering-Reversing-Obfuscation/dp/1118787315
- http://www.amazon.com/Hacking-Securing-iOS-Applications-Hijacking/dp/1449318746
- https://www.owasp.org/index.php/IOS_Application_Security_Testing_Cheat_Sheet
- https://www.theiphonewiki.com/wiki/Bugging_Debuggers
- http://www.opensource.apple.com/source/xnu/xnu-792.13.8/bsd/sys/ptrace.h