EDITORIAL | January 31, 2018

Security Theater and the Watch Effect in Third-party Assessments

Before the facts were in, nearly every journalist and salesperson in infosec was thinking about how to squeeze lemonade from the Equifax breach. Let’s be honest – it was and is a big breach. There are lessons to be learned, but people seemed to have the answers before the facts were available.

It takes time to dissect these situations and early speculation is often wrong. Efforts at attribution and methods take months to understand. So, it’s important to not buy into the hysteria and, instead, seek to gain a clear vision of the actual lessons to be learned. Time and again, these supposed “watershed moments” and “wake-up calls” generate a lot of buzz, but often little long-term effective action to improve operational resilience against cyber threats.


At IOActive we guard against making on-the-spot assumptions. We consider and analyze the actual threats, ever mindful of the “Watch Effect.” The Watch Effect can be simply explained:  you wear a watch long enough, you can’t even feel it.
I won’t go into what third-party assessments Equifax may or may not have had because that’s largely speculation. The company has probably been assessed many times, by many groups with extensive experience in the prevention of cyber threats and the implementation of active defense. And they still experienced a deep impact cyber incursion.

The industry-wide point here is: Everyone is asking everyone else for proof that they’re secure.

The assumption and Watch Effect come in at the point where company executives think their responses to high-level security questions actually mean something.

Well, sure, they do mean something. In the case of questionnaires, you are asking a company to perform a massive amount of tedious work, and, if they respond with those questions filled in, and they don’t make gross errors or say “no” where they should have said “yes”, that probably counts for something.

But the question is how much do we really know about a company’s security by looking at their responses to a security questionnaire?

The answer is, “not much.”

As a company that has been security testing for 20 years now, IOActive has successfully breached even the most advanced cyber defenses across countless companies during penetration tests that were certified backwards and forwards by every group you can imagine. So, the question to ask is, “Do questionnaires help at all? And if so, how much?”
 
Here’s a way to think about that.

At IOActive we conduct full, top-down security reviews of companies that include business risk, crown-jewel defense, and every layer that these pieces touch. Because we know how attackers get in, we measure and test how effective the company is at detecting and responding to cyber events – and use this comprehensive approach to help companies understand how to improve their ability to prevent, detect, and ever so critically, RESPOND to intrusions. Part of that approach includes a series of interviews with everyone from the C-suite to the people watching logs. What we find is frightening.

We are often days or weeks into an assessment before we discover a thread to pull that uncovers a major risk, whether that thread comes from a technical assessment or a person-to-person interview or both.

That’s days—or weeks—of being onsite with full access to the company as an insider.

Here’s where the Watch Effect comes in. Many of the companies have no idea what we’re uncovering or how bad it is because of the Watch Effect. They’re giving us mostly standard answers about their day-to-day, the controls they have in place, etc. It’s not until we pull the thread and start probing technically – as an attacker – that they realize they’re wearing a broken watch.

Then they look down at a set of catastrophic vulnerabilities on their wrist and say, “Oh. That’s a problem.”

So, back to the questionnaire…

If it takes days or weeks for an elite security firm to uncover these vulnerabilities onsite with full cooperation during an INTERNAL assessment, how do you expect to uncover those issues with a form?

You can’t. And you should stop pretending you can. Questionnaires depend far too much upon the capability and knowledge of the person or team filling it out, and often are completed with impartial knowledge. How would one know if a firewall rule were updated improperly to “any/any” in the last week if it is not tested and verified?

To be clear, the problem isn’t that third party assessments only give 2/10 in security assessment value. The problem is that executives THINK it’s giving them 6/10, or 9/10.

It’s that disconnect that’s causing the harm.

Eventually, companies will figure this out. In the meantime, the breaches won’t stop.

Until then, we as technical practitioners can do our best to convince our clients and prospects to understand the value these types of cursory, external glances at a company provide. Very little. So, let’s prioritize appropriately.

EDITORIAL | November 14, 2017

Treat the Cause, not the Symptoms!

With the publication of the National Audit Office report on WannaCry fresh off the press, I think it’s important that we revisit what it actually means. There are worrying statements within the various reports around preventative measures that could have been taken. In particular, where the health service talks about treating the cause, not the symptom, you would expect that ethos to cross functions, from the primary caregivers to the primary security services. 

I read that the NHS Digital team carried out an onsite cyber assessment of 88 out of 236 Trusts. None passed. Not one. Think about this. These trusts are businesses whose core function is the health and well-being of its customers, the patients. If this were a bank, and someone did an onsite assessment and said: “well the bank left all the doors open and didn’t lock the vault”, would you put your hard-earned money in there for safe keeping? I don’t think so. More importantly, if the bank said after a theft of all the money, “well the thieves used masks; we didn’t recognize them; they were very sophisticated”, would you be happy? No. Now imagine what could have been found if someone had carried out an in-depth assessment, thinking like the adversary. 


The report acknowledges the existence of a cyber-attack plan. However, the plan hadn’t been communicated. So, no one knew who was doing what because the plan hadn’t been practiced and perfected. The only communication channel the plan provided for, email, was shut down. This meant that primary caregivers ended up communicating with personal devices using WhatsApp, potentially exposing Patient Medical Records on personal mobile phones through a social messaging tool. 

The report also states the NHS Digital agency had no power to force the Trusts to “take remedial action even if it [NHS Digital] has concerns about the vulnerability of an organization”. At IOActive, we constantly talk to our customers about what to do in the case of a found vulnerability. Simply ticking a box without follow up is a pointless exercise. “My KPI is to perform a security assessment of 50% of the Trusts” – box ticked. That’s like saying “I will perform triage on 50% of my patients, but won’t treat them”. Really?! 

An efficacy assessment of your security practices is not an audit report. It is not a box-ticking exercise. It is a critical function designed specifically to enable you to identify vulnerabilities within your organization’s security posture and empower you to facilitate appropriate controls to manage risk at a business level. Cyber Security and Information Security are not IT issues; they are a business issue. As such, the business should absolutely be focused on having skilled experts providing actionable intelligence, enabling them to make business decisions based on risk, impact and likelihood. It’s not brain surgery, or maybe it is.

It’s generally accepted that, if the bank had taken basic IT security steps, this problem would have been avoided. Treat the cause not the symptom. We are hearing a lot of evidence that this was an orchestrated attack from a nation-state. However, I’m pretty sure, with the basic failures of the NHS Digital to protect the environment, it wouldn’t have taken a nation-state to launch this destructive attack. 

Amyas Morse, Head of NAO said: “It was a relatively unsophisticated attack and could have been prevented by the NHS following basic IT security best practices. There are more sophisticated cyber-threats out there than WannaCry, so the Department and the NHS need to get their act together to ensure the NHS is better protected against future attacks.” I can absolutely guarantee there are more sophisticated attacks out there. 

Eighty-one NHS organizations were impacted. Nineteen-thousand five hundred medical appointments canceled. Six hundred GP surgeries unable to support patients. Five hospitals diverted ambulances elsewhere. Imagine the human factor. You’re waiting for a lifesaving operation – canceled. You’ve been in a car crash – ambulance diverted 40 miles away. All because Windows 7 wasn’t patched. Is that acceptable for an organization trusted with the care and well-being of you and your loved ones? Imagine the damage had this attack been more sophisticated.

Cybersecurity Assessments are not audit activities. They are mission critical assessments for the longevity of your business. The NHS got lucky. There are not many alternatives for health care. It’s not like you can pop down the street and choose the hospital next door. And that means they can’t be complacent about their duty of care. People’s lives are at stake. Treat the cause not the symptoms.

INSIGHTS | June 28, 2017

WannaCry vs. Petya: Keys to Ransomware Effectiveness

With WannaCry and now Petya we’re beginning to see how and why the new strain of ransomware worms are evolving and growing far more effective than previous versions.

I think there are 3 main factors: Propagation, Payload, and Payment.*

  1. Propagation: You ideally want to be able to spread using as many different types of techniques as you can.
  2. Payload: Once you’ve infected the system you want to have a payload that encrypts properly, doesn’t have any easy bypass to decryption, and clearly indicates to the victim what they should do next.
  3. Payment: You need to be able to take in money efficiently and then actually decrypt the systems of those who pay. This piece is crucial, otherwise people will quickly learn they can’t get their files back even if they do pay and be inclined to just start over.


WannaCry vs. Petya

WannaCry used SMB as its main spreading mechanism, and its payment infrastructure lacked the ability to scale. It also had a kill switch, which was famously triggered and halted further propagation.

Petya on the other hand appears to be much more effective at spreading since it’s using both EternalBlue and credential sharing
/ PSEXEC to infect more systems. This means it can harvest working credentials and spread even if the new targets aren’t vulnerable to an exploit.


[NOTE: This is early analysis so some details could turn out to be different as we learn more.]

What remains to be seen is how effective the payload and payment infrastructures are on this one. It’s one thing to encrypt files, but it’s something else entirely to decrypt them.

The other important unknown at this point is if Petya is standalone or a component of a more elaborate attack. Is what we’re seeing now intended to be a compelling distraction?
  
There’s been some reports indicating these exploits were utilized by a sophisticated threat actor against the same targets prior to WannaCry. So it’s possible that WannaCry was poorly designed on purpose. Either way, we’re advising clients to investigate if there is any evidence of a more strategic use of these tools in the weeks leading up to Petya hitting.   

*Note: I’m sure there are many more thorough ways to analyze the efficacy of worms. These are just three that came to mind while reading about Petya and thinking about it compared to WannaCry.

EDITORIAL | June 14, 2017

APIs are 2FA Backdoors

 Two-factor Authentication (2FA) today is something like having a firewall in the year 2000: if you say you have it, it basically stops any further questioning.


Unfortunately, when you have a powerful and mismanaged API, 2FA is about as effective as having a stateful firewall protecting a broken web application.

It’s time we accept as an industry that API keys and secrets are essentially usernames and passwords, except they’re designed to be used in an automated way to perform your company’s most sensitive functions, often instrumented by developers who don’t prioritize security.
 
Other than that, they’re fine.
 
The API Backdoor
 
The next time you’re chatting with someone about 2FA access to some big-name SaaS or product, ask them if they have an API.


They’ll probably respond, “Of course.”

Now ask them what you can do with that API.

“Oh, it’s a great API. You can do pretty much everything.”

“Great. How many people have access?”

“It’s super popular. We give access to all our developers, and any account can ask for and receive a key.”

“Cool. So how many of those keys are out there, and how do you control them?”

“…”

Exactly.

API keys often have full access to the platform, and guess what the access method is: a string of characters for your key, and a string of characters for your secret.

Sound familiar? How is this different from a username and password? 

“Oh, but this is different because it’s all code-ey and stuff. Lots of programming and hard things.”

No.

That’s not a defense. Good APIs also share something else: great documentation.

It’s easy to do things like adding users, adjusting permissions, or pulling data using this interface because it’s meant to be easy. In fact, the easier it is to do something powerful, the better.

And this is all happening on 2FA-enabled accounts, despite that supposed higher level of security.

Summary

  • Everyone understands that 2FA is better than just a username and password.
  • Everyone is also trying to add an API to their new services.
  • API keys are just usernames and passwords used in code.
  • Few people realize this, and think it’s safe because “programming is hard” or because “APIs are magic.”
  • APIs are not magic. They’re an entry point into your application, and there are far too many keys and secrets floating around Slack, Github, and many other places on services that are 2FA-enabled.
  • This presents a false sense of security.


2FA is great. Enable it where you can. But it’s not the end of the conversation. 
Be sure to look at your API as well. Know what you can do with it, know who has keys, know how often they expire, and have a plan for monitoring and response.

For all intents and purposes, you should treat API access like legacy username and password access. After all, API keys and secrets are credentials.

Credentials can be stolen, and credentials can be used to do bad things.

This post is adapted from Daniel Miessler’s original blog post, which you can find at https://danielmiessler.com/blog/apis-2fas-achilles-heel/.

INSIGHTS | September 1, 2016

Five Attributes of an Effective Corporate Red Team

After talking recently with colleagues at IOActive as well as some heads of industry-leading red teams, we wanted to share a list of attributes that we believe are key to any effective Red Team.

[ NOTE: For debate about the relevant terminology, we suggest Daniel’s post titled The Difference Between Red, Blue, and Purple Teams. ]

To be clear, we think there can be significant variance in how Red Teams are built and managed, and we believe there are likely multiple routes to success. But we believe there are a few key attributes that all (or at least most) corporate Red Teams should have as part of their program. These are:

  1. Organizational Independence
  2. Defensive Coordination
  3. Continuous Operation
  4. Adversary Emulation
  5. Efficacy Measurement

Let’s look at each of these.

Organizational Independence is the requirement that the Red Team be able to effectively act as a real-world attacker in terms of scope, tools, and techniques employed. Many organizations restrict their Red Teams to such a degree that they’re basically impotent, which in turn lulls the company into a false sense of security.

Defensive Coordination is the requirement that Red Teams regularly interact with their counterparts on the defensive side to ensure the organization is learning from their activities. If a Red Team is effective on its own, but doesn’t share its knowledge and successes with the defense in order make it stronger, then the Red Team has lost sight of its purpose.

Continuous Operation is the requirement that the organization remain under constant, rolling attack by the Red Team, which is the polar opposite of short, penetration-test style engagements. Red Teams should operate through campaigns that span weeks or months in duration, and both the defensive teams and the general user population should know that at any moment, of any day, they could be targeted by both a Red Team campaign of some sort, or by a real attacker.

Adversary Emulation is the requirement that Red Team campaigns should be regularly updated based on the actual tools, techniques, and processes employed by real-world attackers. If cyber-criminals are doing X this quarter, let’s emulate that. If we’re seeing some state actors doing Y this year, let’s emulate that. If you’re not simulating—to some significant degree—the techniques being used by actual attackers, the Red Team is providing questionable value.

Efficacy Measurement is the requirement that Red Teams know how effective they are at improving the security posture of the organization. If we can’t tell a clear story around how our defenses are improving, i.e., that it’s getting increasingly more difficult to compromise, move laterally, and achieve attacker goals, then you’re getting limited value from any work that’s being done.

Summary

Here’s a pointed capture of those points:

  • If your group is significantly restricted in its scope and capabilities by the organization, you probably don’t have an effective Red Team
  • If your group doesn’t regularly work hand-in-hand with the defensive side of the organization in order to improve the organization’s security posture, you probably don’t have an effective Red Team
  • If your internal or external service operates based on projects that happen once in a while rather than being staggered and continuous, you probably don’t have an effective Red Team
  • If you aren’t constantly updating your attack campaigns based on new intelligence on actual threat actors, you probably don’t have an effective Red Team
  • If you aren’t closely monitoring the effectiveness of the attack campaigns (and the responses to them by the defense) over time, you probably don’t have an effective Red Team

There are many other components of a solid Red Team that were not mentioned—top-end malware kits, elite security talent, deep understanding of the attacker mindset, etc.—but we think these five components are both most fundamental and most lacking.

As always, we would love to hear from other security types who might have a differing opinion. All of our positions are subject to change through exposure to compelling arguments and/or data.
INSIGHTS | March 22, 2016

Inside the IOActive Silicon Lab: Interpreting Images

In the post “Reading CMOS layout,” we discussed understanding CMOS layout in order to reverse-engineer photographs of a circuit to a transistor-level schematic. This was all well and good, but I glossed over an important (and often overlooked) part of the process: using the photos to observe and understand the circuit’s actual geometry.


Optical Microscopy

Let’s start with brightfield optical microscope imagery. (Darkfield microscopy is rarely used for semiconductor work.) Although reading lower metal layers on modern deep-submicron processes does usually require electron microscopy, optical microscopes still have their place in the reverse engineer’s toolbox. They are much easier to set up and run quickly, have a wider field of view at low magnifications, need less sophisticated sample preparation, and provide real-time full-color imagery. An optical microscope can also see through glass insulators, allowing inspection of some underlying structures without needing to deprocess the device.
 
This can be both a blessing and a curse. If you can see underlying structures in upper-layer images, it can be much easier to align views of different layers. But it can also be much harder to tell what you’re actually looking at! Luckily, another effect comes to the rescue – depth of field.


Depth of field

When using an objective with 40x power or higher, a typical optical microscope has a useful focal plane of less than 1 µm. This means that it is critical to keep the sample stage extremely flat – a slope of only 100 nm per mm (0.005 degrees) can result in one side of a 10x10mm die being in razor-sharp focus while the other side is blurred beyond recognition.
 
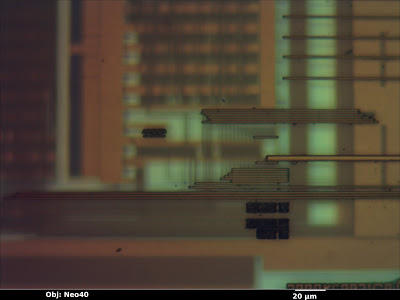
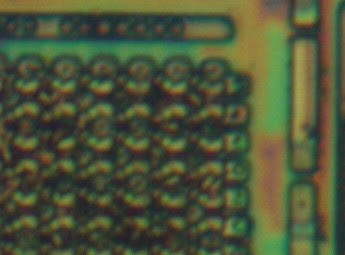
In the image below (from a Micrel KSZ9021RN gigabit Ethernet PHY) the top layer is in sharp focus but all of the features below are blurred—the deeper the layer, the less easy it is to see.
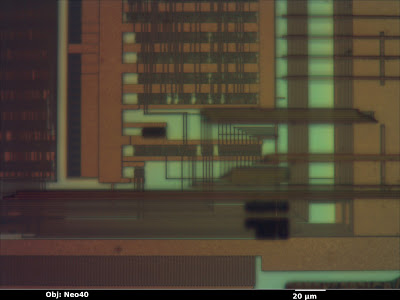
We as reverse engineers can use this to our advantage. By sweeping the focus up or down, we can get a qualitative feel for which wires are above, below, or on the same layer as other wires. Although it can be useful in still photos, the effect is most intuitively understood when looking through the eyepiece and adjusting the focus knob by hand. Compare the previous image to this one, with the focal plane shifted to one of the lower metal layers.
I also find that it’s sometimes beneficial to image a multi-layer IC using a higher magnification than strictly necessary, in order to deliberately limit the depth of field and blur out other wiring layers. This can provide a cleaner, more easily understood image, even if the additional resolution isn’t necessary.


Color

Another important piece of information the optical microscope provides is color.  The color of a feature under an optical microscope is typically dependent on three factors:
  •       Material color
  •        Orientation of the surface relative to incident light
  •        Thickness of the glass/transparent material over it

 
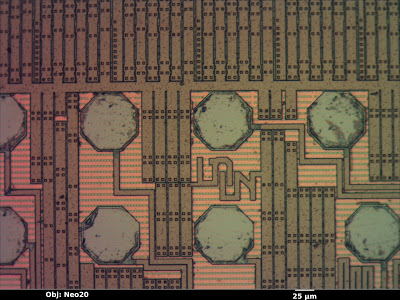
Material color is the easiest to understand. A flat, smooth surface of a substance with nothing on top will have the same color as the bulk material. The octagonal bond pads in the image below (a Xilinx XC3S50A FPGA), for example, are made of bare aluminum and show up as a smooth silvery color, just as one would expect. Unfortunately, most materials used in integrated circuits are either silvery (silicon, polysilicon, aluminum, tungsten) or clear (silicon dioxide or nitride). Copper is the lone exception.
 
Orientation is another factor to consider. If a feature is tilted relative to the incident light, it will be less brightly lit. The dark squares in the image below are vias in the upper metal layer which go down to the next layer; the “sag” in the top layer is not filled in this process so the resulting slopes show up as darker. This makes topography visible on an otherwise featureless surface.
The third property affecting observed color of a feature is the glass thickness above it. When light hits a reflective surface under a transparent, reflective surface, some of the beam bounces off the lower surface and some bounces off the top of the glass. The two beams interfere with each other, producing constructive and destructive interference at wavelengths equal to multiples of the glass thickness.
 
This is the same effect responsible for the colors seen in a film of oil floating on a puddle of water–the reflections from the oil’s surface and the oil-water interface interfere. Since the oil film is not exactly the same thickness across the entire puddle, the observed colors vary slightly. In the image above, the clear silicon nitride passivation is uniform in thickness, so the top layer wiring (aluminum, mostly for power distribution) shows up as a uniform tannish color. The next layer down has more glass over it and shows up as a slightly different pink color.
 
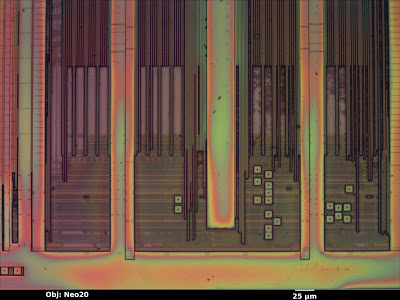
Compare that to the image below (an Altera EPM3064A CPLD). The thickness of the top passivation layer varies significantly across the die surface, resulting in rainbow-colored fringes.
 

Electron Microscopy

The scanning electron microscope is the preferred tool for imaging finer pitch features (below about 250 nm). Due to the smaller wavelength of electron beams as compared to visible light, this tool can obtain significantly higher resolutions.
 
The basic operating principle of a SEM is similar to an old-fashioned CRT display: electromagnets move a beam of electrons in a vacuum chamber in a raster-scan pattern over the sample. At each pixel, the beam interacts with the sample, producing several forms of radiation that the microscope can detect and use for imaging.
 
Electron microscopy in general has an extremely high depth of field, making it very useful for imaging 3D structures. The image below (copper bond wires on a Microchip PIC12F683) has about the same field of view as the optical images from the beginning of this article, but even from a tilted perspective the entire loop of wire is in sharp focus.


Secondary Electron Images

The most common general-purpose image detector for the SEM is the secondary electron detector. When a high-energy electron from the scanning beam grazes an atom in the sample, it sometimes dislodges an electron from the outer shell. Secondary electrons have very low energy, and will slow to a stop after traveling a fairly short distance. As a result, only those generated very near the surface of the sample will escape and be detected.
 
This makes secondary electron images very sensitive to topography. Outside edges, tilted surfaces, and small point features (dust and particulates) show up brighter than a flat surface because a high percentage of the secondary electrons are generated near exposed surfaces of the specimen. Inward-facing edges show up dimmer than a flat surface because a high percentage of the secondary electrons are absorbed in the material.
 
The general appearance of a secondary electron image is similar to a surface lit up with a floodlight. The eye position is that of the objective lens, and the “light source” appears to come from the position of the secondary electron detector.
 
In the image below (the polysilicon layer of a Microchip PIC12F683 before cleaning), the polysilicon word lines running horizontally across the memory array have bright edges, which shows that they are raised above the background. The diamond-shaped source/drain areas have dark “shadowed” edges, showing that they are lower than their surroundings (and thus many of the secondary electrons are being absorbed). The dust particles and loose tungsten via plugs scattered around the image show up very brightly because they have so much exposed surface area.
Compare the above SEM view to the optical image of the same area below. Note that the SEM image has much higher resolution, but the optical image reveals (through color changes) thickness variations in the glass layer that are not obvious in the SEM. This can be very helpful when trying to gauge progress or uniformity of an etch/polish operation.
In addition to the primary contrast mechanism discussed above, the efficiency of secondary electron emission is weakly dependent on the elemental composition of the material being observed. For example, at 20 kV the number of secondary electrons produced for a given beam current is about four times higher for tungsten than for silicon (see this paper). While this may lead to some visible contrast in a secondary electron image, if elemental information is desired, it would be preferable to use a less topography-sensitive imaging mode.
 

Backscattered Electron Images

Secondary electron imaging does not work well on flat specimens, such as a die that has been polished to remove upper metal layers or a cross section. Although it’s often possible to etch such a sample to produce topography for imaging in secondary electron mode, it’s usually easier to image the flat sample using backscatter mode.
 
When a high-energy beam electron directly impacts the nucleus of an atom in the sample, it will bounce back at high speed in the approximate direction it came from. The probability of such a “backscatter” event happening depends on the atomic number Z of the material being imaged. Since backscatters are very energetic, the surrounding material does not easily absorb them. As a result, the appearance of the resulting image is not significantly influenced by topography and contrast is primarily dependent on material (Z-contrast).
 
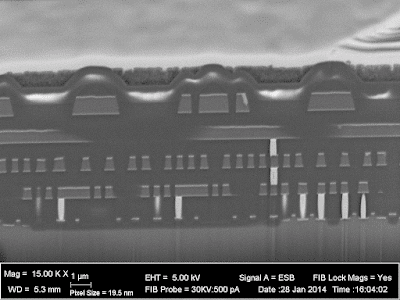
In the image below (cross section of a Xilinx XC2C32A CPLD), the silicon substrate (bottom, Z=14) shows up as a medium gray. The silicon dioxide insulator between the wires is darker due to the lower average atomic number (Z=8 for oxygen). The aluminum wires (Z=13) are about the same color as the silicon, but the titanium barrier layer (Z=22) above and below is significantly brighter. The tungsten vias (Z=74) are extremely bright white. Looking at the bottom right where the via plugs touch the silicon, a thin layer of cobalt (Z=27) silicide is visible.

Depending on the device you are analyzing, any or all of these three imaging techniques may be useful. Knowledge of the pros and cons of these techniques and the ability to interpret their results are key skills for the semiconductor reverse engineer.